Ultimate list of 75 mixed-use developments: Where to find them and prices
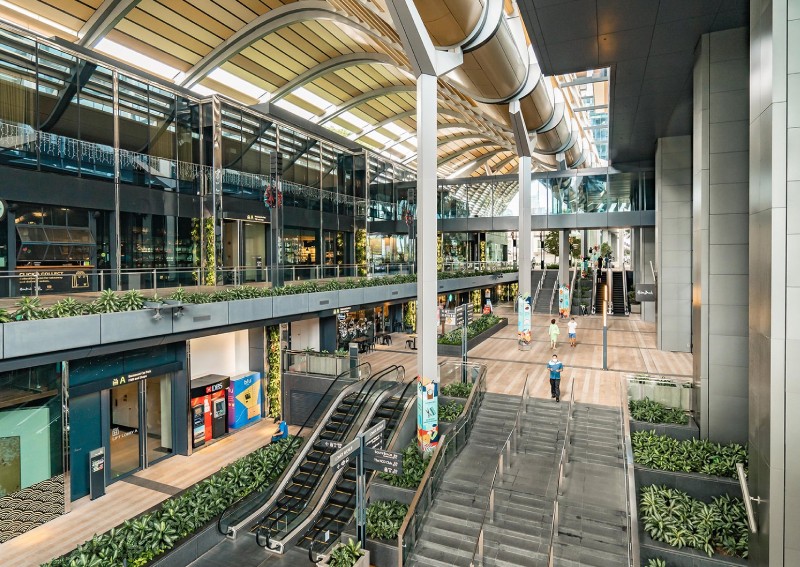
PHOTO: Stackedhomes
Unless you absolutely love peace and quiet, most people prioritise convenience pretty highly on their must-have list.
And while you may point out that it is really easy today to order food and groceries over delivery apps, there’s still nothing quite like popping downstairs to get food as and when you like.
So in an effort to create spaces where people can live, work and play in the same area, more and more mixed-use sites are up for the Government Land Sales (GLS) program.
One of the more notable ones being the recent Marina View White site up for tender with a minimum bid price of $1.508 billion.
You might have also heard of the competition between developers for previous mixed-use development sites.
An example is the one at Tanah Merah Kechil Link which attracted a whopping 15 bids and was ultimately awarded to MCC Land for $248.99 million.
It’s unquestionable that there is a demand for such sites.
Simply put, mixed-use developments are buildings that combine both residential and commercial spaces.
This is achieved commonly by having the first few floors comprised purely of commercial spaces and situating the residential towers on top.
Which is why mixed-use developments are often confused with integrated developments.
While some do use them interchangeably, you can think of it as a better upgrade to a mixed-use development.
Integrated developments are just like mixed-use developments, but have the added benefits of being situated above or next to a transport system, like a bus interchange or a MRT station.
We have previously covered quite extensively about integrated developments here.
Despite not having that additional benefit of having a transport network integrated into the development, mixed-use developments are still highly sought after.
As a one-stop hub for your dining, retail, or entertainment needs, it has been proven that people would pay good money for such ease and convenience.
So if you are looking for a mixed-use development, here’s the ultimate list of them all in one spot!
For simplicity, each residence is sorted by district and further sorted into three regions—Core Central Region (CCR), Rest of Central Region (RCR), and Outside Central Region (OCR).

| Project Name | TOP | Lease | Indicative Avg. Price (PSF) | Indicative Rental (PSF PM) |
| Marina One Residences | 2017 | 99-years | $2,498 | $5.04 |
| One Shenton | 2011 | 99-years | $1,645 | $4.63 |
| The Sail @ Marina Bay | 2008 | 99-years | $1,952 | $4.99 |
Starting off the list are three mixed-use developments in District 1.
The newest of the bunch, Marina One Residences is an award-winning mixed development with 1,042 luxury residential units and 140,000 sqft of retail spaces.
It is also the newest, with One Shenton and The Sail @ Marina Bay getting on in years.
On the rental side, The Sail @ Marina Bay and One Shenton have a gross yield of 3.1 per cent and 3.3 per cent.
Marina One Residences doesn’t fare so well on the rental yield side, with a gross yield of 2.4 per cent but it does fetch the highest rent in the region.
As a gauge, the average gross rental yield of district 1 is 2.9 per cent.
Overall, mixed-use developments in District 1 are faring better than most other residential developments, despite capital losses.
Furthermore, mixed-use developments in the area are extremely popular with renters as they have attained the top 3 rental sales volume.

| Project Name | TOP | Lease | Indicative Avg. Price (PSF) | Indicative Rental (PSF PM) |
| One Bernam | 2026 | 99-years | $2,504 | – |
| Wallich Residence | 2018 | 99-years | $3,440 | $8.70 |
| Eon Shenton | 2017 | 99-years | $2,338 | $5.62 |
| Onze @ Tanjong Pagar | 2017 | Freehold | $2,356 | $5.02 |
District 2 consists of three mixed-use developments with the upcoming One Bernam that will add to the list.
Of the completed properties, Wallich Residence is by far the most recognisable, with the highest priced non-landed residential deal so far from James Dyson. And well, it is also the tallest residential development in Singapore. We’ve got video proof right here.
In terms of rental yield, Wallich Residence, Eon Shenton, and Onze @ Tanjong Pagar have commanded a rental yield of 3.0 per cent, 2.9 per cent, and 2.6 per cent, all of which are below average.
| Project Name | TOP | Lease | Indicative Avg. Price (PSF) | Indicative Rental (PSF PM) |
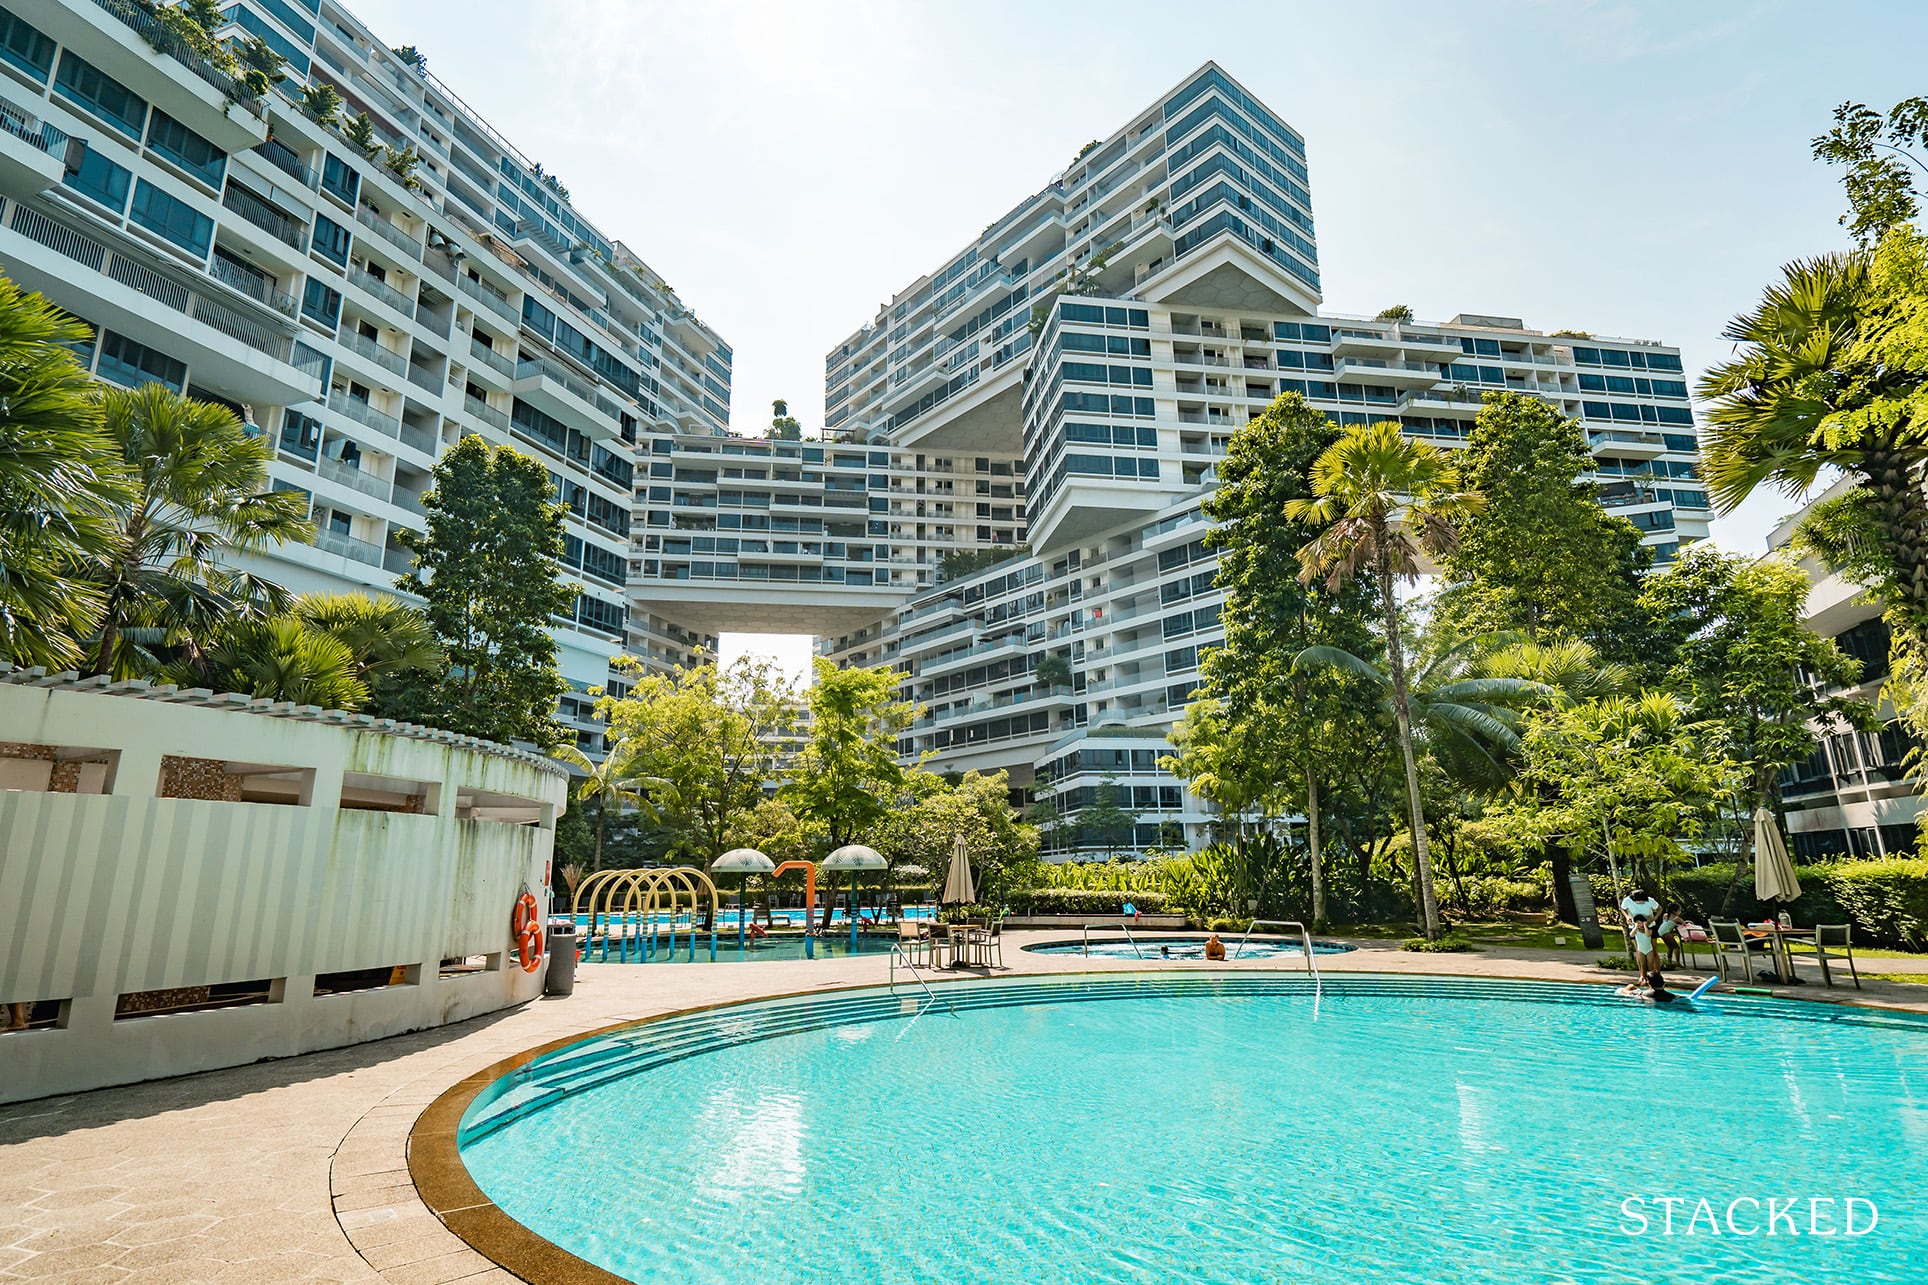
| The Interlace | 2013 | 99-years | $1,210 | $3.46 |
The only mixed-use development in the area is The Interlace, with 1,040 units and eight retail units spread around the development.
It may not have the best connectivity (it isn’t near an MRT), but the unique architecture and big units do give it a good niche to be in.
Let’s also say that most owners there have made a pretty penny, with 318 profitable transactions and just 22 unprofitable ones so far.
Furthermore, it commanded a gross rental yield of 3.5 per cent, the highest in District 4.
ALSO READ: One Pearl Bank review: Impressive architecture, great location, but could be impractical for some

| Project Name | TOP | Lease | Indicative Avg. Price (PSF) | Indicative Rental (PSF PM) |
| Eden Residences Capitol | 2015 | 99-years | $3,020 | $4.52 |
Eden Residences Capitol is one of the few non-strata residential developments in the district and caters to the upscale market.
Consisting of only 39 residential units, Eden Residences Capitol shares its space with a high-end retail component, the Capitol Piazza and the Capitol Kempinski Hotel.
Due to limited data on sales transactions, we are unable to determine the capital gains from the development.
For gross rental yield, Eden Residences Capitol commands a 1.8 per cent gross yield, significantly lower than the national average, which is obviously attributed to its high prices.

Home to the new Guoco Midtown development by Guocoland, District 7 is no stranger to mixed developments.
Both Midtown Modern and Midtown Bay are part of the collective Guoco Midtown project offering unparalleled convenience to its residents.
Adding on to the city skyline is The M, a mixed-use development with 522 residential units and one level of retail spaces.
These three up-and-coming developments are definitely pricey, with only South Beach Residences surpassing them in the average pricing per square foot.
Comparatively, City Gate offers the most affordable entry price into District 7, although its immediate location is definitely not as sought after.
Furthermore, it has a 2.77 per cent rental yield, just slightly lower than South Beach Residences (2.65 per cent), but it is considered relatively low in a district that has a number of older developments.

| Project Name | TOP | Lease | Indicative Avg. Price (PSF) | Indicative Rental (PSF PM) |
| Cairnhill Nine | 2016 | 99-years | $2,281 | $6.54 |
| The Orchard Residences | 2010 | 99-years | $3,448 | $6.06 |
| Scotts Square | 2011 | Freehold | $3,748 | $6.23 |
| Lucky Plaza Apartments | 1981 | Freehold | $2,019 | $3.31 |
| Orchard Towers | 1975 | Freehold | $1,320 | $2.19 |
Know as THE shopping district in Singapore, District 9 is not short on commercial properties.
The 268-unit Cairnhill Nine is integrated with the Ascott Hotel as well as having a direct link bridge to Paragon Mall.
In terms of gross rental yield, Cairnhill Nine is just average with other developments in the district, coming in at 3.7 per cent.
It is a lot better than Lucky Plaza Apartments, however, with a 1.97 per cent rental yield.
ALSO READ: Dairy Farm Residences review: 84m infinity pool and 40,000 sqft retail

| Project Name | TOP | Lease | Indicative Avg. Price (PSF) | Indicative Rental (PSF PM) |
| One Holland Village Residences | 2025 | 99-years | $2,736 | – |
| D’Leedon | 2014 | 99-years | $1,664 | $4.80 |
One Holland Village Residences is the newest mixed-use development in the area, and is set to provide a much-needed boost of retail and dining options when it is completed in 2025.
With so much competition from surrounding new launch developments, One Holland Village Residences sits around the middle in terms of average asking prices for their units.
In comparison, D’Leedon (another 99-year mixed-use development), sitting at $1,664 per square foot is one of the lower average prices in the district.
D’Leedon has a gross rental yield of around 3.0 per cent, which is just about average for the area.

| Project Name | TOP | Lease | Indicative Avg. Price (PSF) | Indicative Rental (PSF PM) |
| Avenue South Residences | 2023 | 99-years | $2,177 | – |
| Artra | 2021 | 99-years | $1,898 | $4.87 |
The upcoming Avenue South Residences has been popular amongst home buyers, selling more units than other up-and-coming residential developments in the area.
It may be thanks to lower asking prices in comparison to other developments such as Riviere ($2,610) and One Pearl Bank ($2,404).
The other mixed-use development, Artra, was only completed in 2021, and has a gross rental yield of about 3.1 per cent, which is in the top 20 in terms of rental yield for current residential developments in the area.

| Project Name | TOP | Lease | Indicative Avg. Price (PSF) | Indicative Rental (PSF PM) |
| Uptown @ Farrer | 2022 | 99-years | $1,881 | – |
With none of the current residential developments being mixed-use, we are all looking at how Uptown @ Farrer will fare in the district.
With 116 residential units and 3 levels of shops, Uptown @ Farrer is definitely one of the priciest in the district.
On average, other developments in the district reap about 3.4 per cent to 5.9 per cent in gross rental yield.

| Project Name | TOP | Lease | Indicative Avg. Price (PSF) | Indicative Rental (PSF PM) |
| Kallang Riverside | 2019 | Freehold | $2,270 | $4.43 |
| VIIO @ Balestier | 2018 | Freehold | $1,774 | $4.17 |
| One Dusun Residences | 2017 | Freehold | $1,543 | $4.27 |
| Okio | 2015 | Freehold | $1,356 | $4.37 |
Moving on to District 12, we have a number of notable freehold mixed-use developments.
Okio is the “oldest” development, having been completed in 2015, but prices have been pretty stagnant since launch.
In comparison, One Dusun Residences, Kallang Riverside, and VIIO @ Balestier have not deviated too much from historical prices.
That said, Okio is performing relatively well in gross rental yield, at a steady 3.9 per cent.
Kallang Riverside, the newest and the priciest, received a gross rental yield of 2.34 per cent.
VIIO @ Balestier and One Dusun Residences reaped a gross rental yield of 2.82 per cent and 3.32 per cent respectively.

| Project Name | TOP | Lease | Indicative Avg. Price (PSF) | Indicative Rental (PSF PM) |
| Woodleigh Residences | 2022 | 99-years | $2,141 | – |
| The POIZ Residences | 2018 | 99-years | $1,687 | $4.46 |
| Sennett Residence | 2016 | 99-years | $1,347 | $3.89 |
| The Venue Residences | 2017 | 99-years | $1,491 | $4.16 |
Next, District 13 boasts a few exciting mixed-used developments amongst residential developments of all ages.
Compared to other districts, District 13 has fared well in terms of average capital gains.
The POIZ Residence had a capital gain of 19.2 per cent, while The Venue Residences and Sennett Residence attained a capital gain of 1.9 per cent.
In terms of gross rental yields, the highest of the bunch would be Sennett Residences, at 3.4 per cent, followed by The Venue Residences at 3.3 per cent, and lastly, the POIZ Residences at 3.2 per cent.
ALSO READ: Singapore's major integrated developments: A 5-year update

| Project Name | TOP | Lease | Indicative Avg. Price (PSF) | Indicative Rental (PSF PM) |
| Tedge | 2024 | Freehold | $1,648 | – |
| Park Place Residences | 2019 | 99-years | $1,923 | $5.45 |
| Pavilion Square | 2016 | Freehold | $1,316 | $5.11 |
| Treasures @ G19 | 2015 | Freehold | $1,515 | $4.29 |
| Le Regal | 2016 | Freehold | $1,225 | $3.96 |
District 14 has been gaining quite the popularity amongst developers as we see a number of exciting up-and-coming developments in the area after the en bloc craze in 2017 and 2018.
For mixed-use developments, the price range varies significantly, with Park Place Residences, arguably the most accessible one of all, coming up to the $1,900 mark.
In the rental aspect, Le Regal and Pavilion Square have performed well to attain a 3.9 per cent and 4.7 per cent gross rental yield, respectively.
Next comes Park Place Residences and Treasures @ G19 with a 3.4 per cent gross rental yield.

| Project Name | TOP | Lease | Indicative Avg. Price (PSF) | Indicative Rental (PSF PM) |
| 77 @ East Coast | 2022 | Freehold | $1,773 | – |
| Katong Regency | 2015 | Freehold | $1,753 | $4.01 |
| Siglap V | 2014 | Freehold | $1,305 | $3.25 |
Known for all the freehold properties in the area, District 15 has properties spanning all the way from the 1960s to the 2020s, with the gap between new launch and resale here notably wide.
Amongst all the residential properties, only three are mixed-use developments, however.
Newer freehold properties in the area have seen a dip in prices and incurred capital losses.
However, gross rental yields have been low for both Siglap V and Katong Regency, which are 2.99 per cent and 2.75 per cent respectively.
This is considered low for the region, where gross rental yields can go up to 5.3 per cent.

| Project Name | TOP | Lease | Indicative Avg. Price (PSF) | Indicative Rental (PSF PM) |
| Normanton Park | 2023 | 99-years | $1,773 | – |
| One-North Eden | 2023 | 99-years | $1,993 | – |
| Bijou | 2018 | Freehold | $2,003 | $4.86 |
| NEWest | 2017 | 99-years | $948 | $3.70 |
| Viva Vista | 2014 | Freehold | $1,496 | $5.15 |
Moving on to the OCR regions, we see quite a few current as well as upcoming mixed-use developments.
Normanton Park and One-North Eden have been extremely popular among home buyers, with Normanton Park coming in with the highest sale volume and One-North Eden in third in sales volume in the past six months.
Next, looking at gross rental yield, NEWest and Viva Vista is high on the list with 4.7 per cent and 4.1 per cent gross rental yield.
Meanwhile, the freehold Bijou comes in at 2.91 per cent for gross rental yield, not too surprising considering the high price point.
In fact, Bijou has the highest average price per square foot among all the developments in the area.

| Project Name | TOP | Lease | Indicative Avg. Price (PSF) | Indicative Rental (PSF PM) |
| East Village | 2014 | Freehold | $1,406 | $3.08 |
| Bedok Residences | 2015 | 99-years | $1,501 | $3.95 |
In the district of Bedok and Upper East Coast, there are two mixed-use developments.
Built in 2014, the prices of East Village have been stable at the $1,400 mark, slightly higher than similar properties in the area.
Its gross rental yield is around 2.63 per cent, much lower than most properties that yield between 3.1-3.8 per cent.
And of course, there is the well-known Bedok Residences (an integrated development) with a rental yield of 3.16 per cent.

| Project Name | TOP | Lease | Indicative Avg. Price (PSF) | Indicative Rental (PSF PM) |
| Parc Komo | 2023 | Freehold | $1,530 | – |
There is currently no completed mixed-use development in the District 17 area.
Currently, Parc Komo will be the first of its kind in the district.
They have recently announced that they have pre-leased 60 per cent of its commercial units, with NTUC Fairprice Finest coming on as an anchor tenant – which will be a huge boon to the area which is currently underserved.

| Project Name | TOP | Lease | Indicative Avg. Price (PSF) | Indicative Rental (PSF PM) |
| Coco Palms | 2018 | 99-years | $1,239 | $3.44 |
Currently the only mixed-use development in the area, Coco Palms has remained one of the more popular condominiums in the district.
It is, after all, the closest new condo in the area that is the last and biggest of five condos (D’Nest, Livia, NV Residences, The Palette) in the Pasir Ris Grove enclave, developed by CDL in a joint venture with Hong Leong Holdings.
It is also the closest in terms of walking distance to Pasir Ris MRT and currently has a rental yield of 3.31 per cent.
That is set to change though, with the recently announced Pasir Ris 8 – an integrated development that will take the crown of the most convenient condominium in the area.

| Project Name | TOP | Lease | Indicative Avg. Price (PSF) | Indicative Rental (PSF PM) |
| Affinity @ Serangoon | 2024 | 99-years | $1,563 | – |
| Sengkang Grand Residences | 2023 | 99-years | $1,699 | – |
| Kingsford Waterbay | 2018 | 99-years | $1,264 | $3.60 |
| Stars of Kovan | 2020 | 99-years | $1,619 | $4.19 |
| Midtown Residences | 2016 | 99-years | $1,309 | $3.78 |
| Spazio @ Kovan | 2017 | Freehold | $1,412 | $3.80 |
| Watertown | 2017 | 99-years | $1,373 | $3.52 |
| Compass Heights | 2002 | 99-years | $884 | $2.39 |
Now in District 19, mixed-use developments are not performing as well as some may expect (we’ll delve deeper in another article).
The pricey Stars of Kovan saw limited growth in prices despite being a mixed-use development proximate to Kovan MRT station.
Instead, we saw significant capital gains from other older developments, namely Chuan Green which has appreciated 108 per cent since its completion in 2002.
On the whole, the district has a significant disparity in capital gains, while the mixed-use developments mentioned saw little change in prices.
In terms of gross rental yield, Midtown Residences had a 3.48 per cent rental yield, followed by Kingsford Waterbay with a 3.42, Spazio @ Kovan at 3.23, and lastly, Stars of Kovan with 3.11 per cent. Watertown condo is the lowest with a rental yield of 3.08 per cent.
These are rather lacking considering that the top 20 developments with the highest rental yield have a 3.6 per cent and higher.

| Project Name | TOP | Lease | Indicative Avg. Price (PSF) | Indicative Rental (PSF PM) |
| 183 Longhaus | 2020 | Freehold | $1,467 | $4.03 |
| Thomson V Two | 2012 | Freehold | $1,376 | $4.21 |
Moving on to District 20 where there are a significant number of older residences, 183 Longhaus and Thomson V Two have fared very well.
For one, Thomson V Two has appreciated 8.7 per cent since launch.
While not the highest nor the lowest, most properties scoring the highest capital gains are much older properties built in the late 1980s and 1990s.
Furthermore, Thomson V Two has the highest gross rental yield of 3.7 per cent, followed by 183 Longhaus with 3.3 per cent.

| Project Name | TOP | Lease | Indicative Avg. Price (PSF) | Indicative Rental (PSF PM) |
| The Linq @ Beauty World | 2023 | Freehold | $2,029 | – |
| The Hillford | 2017 | 99-years | $1,192 | $4.61 |
| KAP Residences | 2016 | Freehold | $1,819 | $3.82 |
| Beauty World Plaza | 1982 | 99-years | $1,322 | $2.66 |
Another relatively older district, older developments have outperformed the newer mixed-use developments in capital gains as their appreciation accounts not only for growth in popularity of the area but also natural growth in property prices in Singapore.
However, the Hillford is still a firm winner when it comes to rental yields, as it reaped a 4.7 per cent gross rental yield for homeowners.
KAP Residences, however, performed below average at a 2.52 per cent gross rental yield while Beauty World Plaza has a 2.42 per cent gross rental yield.

| Project Name | TOP | Lease | Indicative Avg. Price (PSF) | Indicative Rental (PSF PM) |
| Centris | 2009 | 99-years | $1,131 | $3.11 |
The Centris is getting on in years but it is an important integrated development in the Jurong West area with a gross rental yield of 3.3 per cent.

| Project Name | TOP | Lease | Indicative Avg. Price (PSF) | Indicative Rental (PSF PM) |
| Dairy Farm Residences | 2024 | 99-years | $1,582 | – |
| Le Quest | 2021 | 99-years | $1,467 | $4.37 |
| Hillion Residences | 2017 | 99-years | $1,510 | $4.07 |
| The Hillier | 2016 | 99-years | $1,409 | $3.54 |
| The Tennery | 2014 | 99-years | $1,115 | $3.07 |
Moving on to District 23, the newly built Le Quest is popular among renters as the development, despite commanding relatively higher rent than similar developments. And it has a significant number of rental contracts signed in the last 6 months.
On top of that, it has one of the higher gross rental yields, at 3.6 per cent.
There is also The Hillier that is connected to HillV2 Mall which has a gross rental yield of 3.06 per cent.
Adding to the list of mixed-use developments in the future will be Dairy Farm Residences, with 40,000 square feet of retail space.
In the Bukit Panjang area you have Hillion Residences (an integrated development), along with The Tennery , which command a rental yield of 3.23 per cent and 3.31 per cent respectively.

| Project Name | TOP | Lease | Indicative Avg. Price (PSF) | Indicative Rental (PSF PM) |
| The Wisteria | 2018 | 99-years | $1,243 | $3.41 |
| North Park Residences | 2018 | 99-years | $1,602 | $3.88 |
| Nine Residences | 2015 | 99-years | $1,167 | $3.36 |
District 27, with the renovation of the Northpoint into a large, integrated mega-mall, the number of residential properties has grown quite significantly.
North Park Residences has been a winner since it launched, with 44 profitable and just two unprofitable transactions so far.
That said, the rental yield is on the low side at 2.91 per cent.
Considering the size of this district, The Wisteria and Nine Residences serve to provide retail options to the surrounding developments.
The Wisteria has appreciated 21.6 per cent since launch.
While significant as compared to a lot of other developments outside of the district, appreciation of properties in the area is quite common, as there are several other properties that have appreciated 20 per cent or more.
In terms of gross rental yield, Nine Residences has fared well with a 3.5 per cent and the Wisteria with a 3.3 per cent gross rental yield.

| Project Name | TOP | Lease | Indicative Avg. Price (PSF) | Indicative Rental (PSF PM) |
| High Park Residences | 2019 | 99-years | $1,258 | $3.77 |
| The Greenwich | 2013 | 99-years | $1,075 | $2.82 |
District 28, with two mixed-use developments, has performed drastically differently.
High Park Residences, since its completion in 2019, has a 20.4 per cent appreciation in prices, while The Greenwich, saw lowered prices of 6.9 per cent.
It is likely due to the more favourable location of High Park Residences near Thanggam LRT station, whereas The Greenwich is much less accessible.
High Park Residences has also reaped a 3.6 per cent gross rental yield, the highest in the district.
The Greenwich is in at 3.2 per cent, performing above average in the area.
ALSO READ: S'pore-KL rail: Mixed-use development around station
This is just an overview of all the mixed-use developments that you can find in Singapore. Next up, an analysis of the performance of mixed-use developments and general trends!
For more in-depth looks at these properties and news on trends in the Singapore private property market, follow us on Stacked . We provide reviews of new and resale condos alike.
This article was first published in Stackedhomes.