

5 interesting takeaways from the rare property losses in Singapore's booming market in 2022

PHOTO: Stackedhomes
2022 was one of the hottest years on record for the property market. Housing supply was (and still is) at a critically low point, and prices rose across all segments despite cooling measures. It would seem as though sellers couldn’t take a bad step during 2022.
This is why we thought it would be fascinating to see those who actually lost money in 2022 (however few there were) and see what commonalities we could find with the data:
| Type | Volume |
| Breakeven | 28 |
| Gain | 13,210 |
| Loss | 733 |
| Total | 13,971 |
We counted 13,971 private non-landed transactions with previous buy records in 2022. Of all the transactions we looked at, around 5.25 per cent (733 transactions) were losses.
Note: In 2022, there were 22,888 private non-landed (including ECs) transactions and 14,567 of them are sub sale and resale transactions (new sales are of no interest here since there’s no loss on a new sale as it’s the first purchase). Of these, 13,971 had a record allowing us to record its gain or loss. This is by no means representative of the entire property market as URA only records transactions where caveats are lodged.
The vast majority, unsurprisingly, were profitable as it was a hot market (94.5 per cent, or 13,210 transactions, were profitable). A tiny number, just 28 transactions, broke even.
While 5.25 per cent is a small number, it’s still interesting to try and observe where and how transactions can go still go wrong; even during a strong seller’s market.
Sub sales (i.e., selling a new launch unit before it’s built) are usually expected to do well in a low-supply situation. Home buyers are in urgent need of units they can move into sooner, and some buyers may be willing to offer even more than the price of a new sale.
Even so, some people managed to lose money in sub sales. The highest recorded loss was $297,600 before factoring in the Sellers Stamp Duty (SSD) of four per cent (this was a unit sold in Riviere). Here are some of the others we found:
Store Ad In-Content Desktop/Tablet 20 per cent Placement
| Project Name | Price | Size (sqft) | $PSF | Buy Price | Buy Date | Years Held | Quantum Loss | per cent Loss |
| RIVIERE | $3,900,000 | 1,711 | $2,279 | $4,197,600 | 11/5/2020 | 2.1 | -$297,600.00 | -7.0 per cent |
| PARK COLONIAL | $2,200,000 | 1,410 | $1,560 | $2,403,000 | 12/26/2018 | 3.1 | -$203,000.00 | -8.0 per cent |
| GEM RESIDENCES | $1,800,000 | 1,055 | $1,706 | $1,939,000 | 6/23/2018 | 4.1 | -$139,000.00 | -7.0 per cent |
| SKY EVERTON | $1,575,000 | 646 | $2,439 | $1,707,000 | 7/1/2019 | 3.1 | -$132,000.00 | -8.0 per cent |
| MARTIN MODERN | $1,880,000 | 764 | $2,460 | $1,990,800 | 3/30/2019 | 3.4 | -$110,800.00 | -6.0 per cent |
| BUKIT 828 | $1,890,000 | 1,335 | $1,416 | $1,982,000 | 6/28/2020 | 1.6 | -$92,000.00 | -5.0 per cent |
| 33 RESIDENCES | $1,030,000 | 700 | $1,472 | $1,113,000 | 9/16/2018 | 3.8 | -$83,000.00 | -7.0 per cent |
| MIDTOWN BAY | $1,320,000 | 463 | $2,852 | $1,390,000 | 10/12/2019 | 2.4 | -$70,000.00 | -5.0 per cent |
| ONE MEYER | $1,615,000 | 614 | $2,632 | $1,665,000 | 3/13/2019 | 3.4 | -$50,000.00 | -3.0 per cent |
| THE WOODLEIGH RESIDENCES | $1,360,000 | 646 | $2,106 | $1,394,000 | 11/10/2018 | 3.6 | -$34,000.00 | -2.0 per cent |
| AFFINITY AT SERANGOON | $1,810,000 | 1,249 | $1,450 | $1,842,000 | 6/2/2018 | 3.8 | -$32,000.00 | -2.0 per cent |
We do note, however, that losses from sub sale units on average are still lower than losses from resale. The sub sale losses averaged -5.48 per cent, whereas among resale losers, the average was – 8.27 per cent.
We also compared between sale types, and found that those who bought new and resold (new sale to resale) lost the highest on average, at – 8.5 per cent. This could be explained by the mispricing that could occur during a new launch considering the mismatch of expectations versus reality later on.
Interestingly, those who went from sub sale to resale chalked up a lower loss, at an average of -7.4 per cent.
| Sale Type | Average per cent Loss |
| New Sale to Resale | -8.5 per cent |
| New Sale to Sub Sale | -5.5 per cent |
| Resale to Resale | -8.1 per cent |
| Sub Sale to Resale | -7.4 per cent |
That’s surprising, since subsale units usually cost more than new sale units (that’s usually the reason for the first buyer deciding to sell before completion). We don’t really have an explanation for this, other than perhaps higher interest rates giving some initial buyers cold feet.
| District | per cent Loss | Volume |
| 1 | -12 per cent | 66 |
| 2 | -7 per cent | 32 |
| 3 | -6 per cent | 13 |
| 4 | -12 per cent | 68 |
| 5 | -6 per cent | 22 |
| 7 | -5 per cent | 5 |
| 8 | -6 per cent | 18 |
| 9 | -13 per cent | 123 |
| 10 | -8 per cent | 52 |
| 11 | -8 per cent | 20 |
| 12 | -5 per cent | 16 |
| 13 | -6 per cent | 8 |
| 14 | -5 per cent | 36 |
| 15 | -6 per cent | 36 |
| 16 | -5 per cent | 45 |
| 17 | -2 per cent | 9 |
| 18 | -4 per cent | 9 |
| 19 | -4 per cent | 42 |
| 20 | -6 per cent | 5 |
| 21 | -3 per cent | 2 |
| 22 | -7 per cent | 3 |
| 23 | -4 per cent | 30 |
| 25 | -5 per cent | 9 |
| 27 | -5 per cent | 13 |
| 28 | -10 per cent | 21 |
The highest losses were in districts 1 (Marina Square, Boat Quay), 4 (Sentosa), and 9 (Cairnhill, Orchard).
This is unsurprising, as during the 2007-2012 property market period, projects such as Reflections At Keppel Bay (District 4) came up and saw a lot of losses. In District 1, projects such as The Sail @ Marina Bay, and Marina Bay Suites also saw a lot of losses. In District 9, projects such as Helios Residences and Scotts Square also saw big losses.
We can say that the higher activity in these areas is due to the return of affluent foreign buyers, as well as investors who foresee an uptick in the rental market. However, the highest losses also tended to come from these areas.
Prime region condos have a very high quantum, and discounts to move them tend to be quite substantial (this is partly why the “million-dollar Orchard/Sentosa loss” is almost a cliché). At these price levels, the price drops might not really cause a dent for some of these wealthy owners, and they would be more willing to sell at a big loss and move on than your average owner.
For those who believe in freehold condos, we have some bad news. Among losses, freehold condos took a marginally worse hit, with losses averaging 8.49 per cent.
Leasehold condo losses averaged 8.05 per cent; perhaps due to their lower initial prices (freehold condos cost typically cost 15 to 20 per cent more as a rule of thumb).
It’s a slim gap between the two; but it does go to show that freehold doesn’t always make much difference.
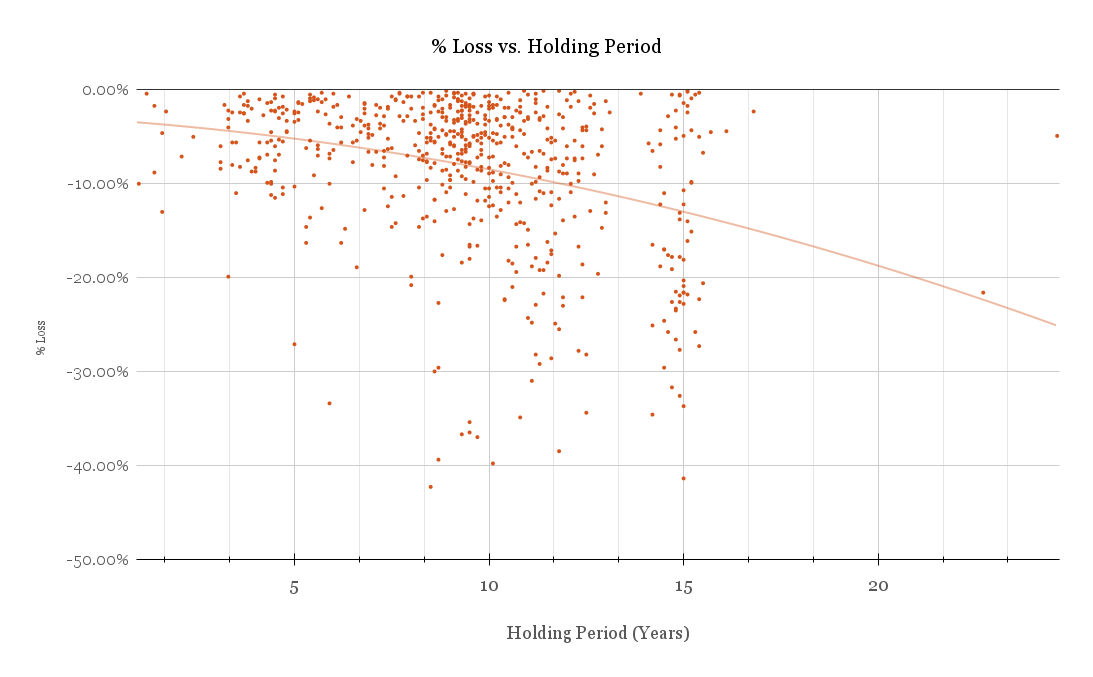
Conventional wisdom holds that, the longer you hold a property, the higher the returns – or at least the lower the losses – should be. But when we plotted the holding period against the losses in a scatterplot, we found the opposite.
Before jumping to conclusion that “the longer you hold, the more you lose”, here’s what the scatterplot looks like if we take gains into consideration too:
So what could explain the strange pattern in the losses?
When we dug into the transaction data, we found some things of interest:
Do you see a pattern here? Most were purchased between 2007 – 2012. As a result, the data is skewed towards heavier losses in the 10-15 year holding period.
This makes sense since during this period, property prices were moving fast which gave way to greater chances of property mispricing in the primary market. In other words, developers may have overhyped certain projects during the run-up in prices, and when reality came, these prices were not a true reflection (get it?!) of prices then.
To confirm this, we looked deeper and found the following:
As you can see, most of these purchases occurred in the primary market (or in the case of sub sales, when the project hasn’t reached TOP).
Apart from that, we also wanted to highlight two outliers in the scatterplot which registered losses even though they were held for more than two decades. This would be an extreme oddity in the market and are likely due to special circumstances (e.g., divorce, selling to their own children, or so forth).
| Project Name | Price | Size (sqft) | $PSF | Buy Price | Buy Date | Years Held | Quantum Loss | % Loss |
| CHELSEA GARDENS | $3,700,000 | 1959 | $1,889 | $3,890,000 | 6/12/1997 | 24.6 | -$190,000.00 | -4.9% |
| CHANGI GREEN | $980,000 | 872 | $1,124 | $1,250,000 | 10/1/1999 | 22.7 | -$270,000.00 | -21.6% |
On a related note, here’s another way to view the losses:
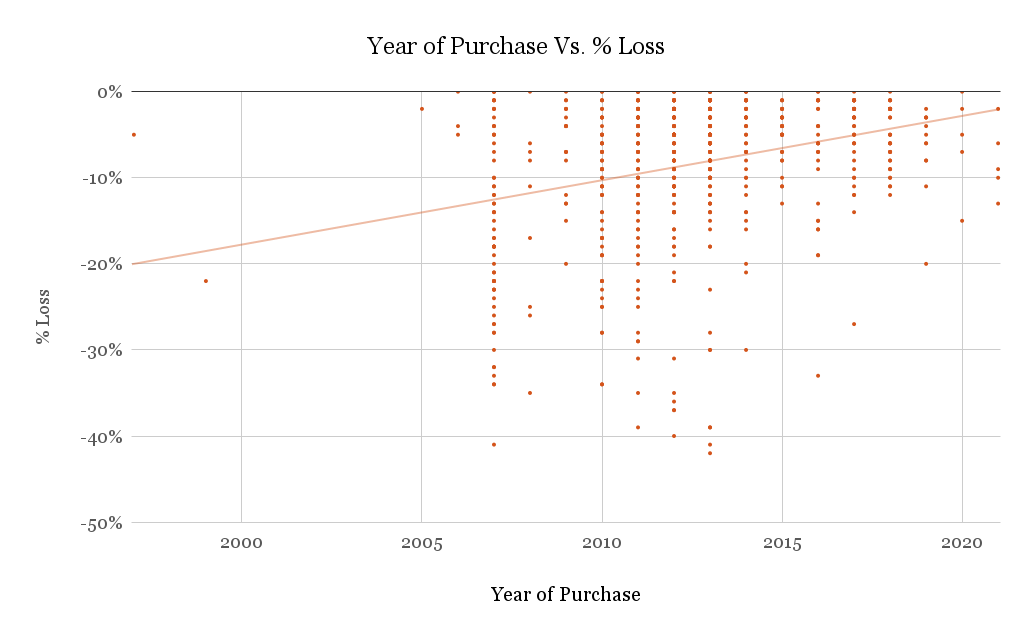
Here we plot the year of the property purchase, to the percentage loss in its transaction. Again, you can see that a longer holding period seems to correspond to higher losses.
| Property Type | Average of quantum | Average of percent_gain | Average of annualised_returns |
| Apartment | -$176,369 | -7.7% | -1.0% |
| Condominium | -$382,004 | -8.8% | -1.0% |
| Detached House | -$2,666,540 | -16.0% | -2.5% |
| Executive Condominium | -$58,600 | -5.4% | -0.6% |
| Semi-Detached House | -$350,012 | -8.2% | -1.6% |
| Terrace House | -$402,571 | -11.1% | -1.3% |
Detached houses lost around 16 per cent on average, with terrace houses following at a loss of about 11 per cent.
Among the losing transactions, Executive Condos (ECs) were the most spared, with average losses at just around 5.3 per cent.
This is likely due to the initial pricing of the properties. ECs are cheaper on average, which diminishes losses for the first batch of sellers.
Biggest losers by name
The following projects saw the biggest losses based on overall loss (quantum):
| Project Name | Price | Size (sqft) | $PSF | Buy Price | Buy Date | Years Held | Quantum Loss | % Loss | Annualised Loss | Type of Sale | Tenure |
| THE MARQ ON PATERSON HILL | $13,380,000 | 3089 | $4,331 | $20,542,400 | 40865 | 10.8 | -$7,162,400 | -34.90% | -3.90% | New Sale to Resale | Freehold |
| PATERSON SUITES | $13,800,000 | 6663 | $2,071 | $20,000,000 | 40865 | 11.1 | -$6,200,000 | -31.00% | -3.30% | Resale to Resale | Freehold |
| REFLECTIONS AT KEPPEL BAY | $5,850,000 | 3993 | $1,465 | $9,981,000 | 39212 | 15.0 | -$4,131,000 | -41.40% | -3.50% | New Sale to Resale | Leasehold |
| SEASCAPE | $5,900,000 | 3380 | $1,746 | $9,600,000 | 40555 | 11.8 | -$3,700,000 | -38.50% | -4.00% | New Sale to Resale | Leasehold |
| REFLECTIONS AT KEPPEL BAY | $12,200,000 | 6835 | $1,785 | $15,554,000 | 39321 | 15.0 | -$3,354,000 | -21.60% | -1.60% | New Sale to Resale | Leasehold |
| MARINA BAY SUITES | $5,000,000 | 2691 | $1,858 | $8,250,000 | 41619 | 8.7 | -$3,250,000 | -39.40% | -5.60% | New Sale to Resale | Leasehold |
| BELLE VUE RESIDENCES | $4,702,000 | 3552 | $1,324 | $7,400,000 | 41155 | 9.5 | -$2,698,000 | -36.50% | -4.70% | Resale to Resale | Freehold |
| THE LUMOS | $5,737,875 | 2433 | $2,359 | $8,433,000 | 39314 | 15.0 | -$2,695,125 | -32.00% | -2.50% | New Sale to Resale | Freehold |
| MARINA COLLECTION | $5,050,000 | 3412 | $1,480 | $7,700,000 | 40324 | 12.5 | -$2,650,000 | -34.40% | -3.30% | New Sale to Resale | Leasehold |
| CLIVEDEN AT GRANGE | $5,700,000 | 2153 | $2,648 | $8,341,040 | 39297 | 14.7 | -$2,641,040 | -31.70% | -2.60% | New Sale to Resale | Freehold |
| MARINA BAY RESIDENCES | $9,400,000 | 4435 | $2,120 | $11,979,000 | 39274 | 14.8 | -$2,579,000 | -21.50% | -1.60% | New Sale to Resale | Leasehold |
| CLIVEDEN AT GRANGE | $8,300,000 | 2842 | $2,921 | $10,824,540 | 39286 | 14.8 | -$2,524,540 | -23.30% | -1.80% | New Sale to Resale | Freehold |
| SILVERSEA | $9,500,000 | 4467 | $2,127 | $12,000,000 | 41745 | 8.0 | -$2,500,000 | -20.80% | -2.90% | New Sale to Resale | Leasehold |
| GRANGE INFINITE | $5,800,000 | 2573 | $2,255 | $8,236,533 | 39350 | 14.5 | -$2,436,533 | -29.60% | -2.40% | New Sale to Resale | Freehold |
| CLIVEDEN AT GRANGE | $8,000,000 | 2842 | $2,815 | $10,336,920 | 39235 | 14.9 | -$2,336,920 | -22.60% | -1.70% | New Sale to Resale | Freehold |
| CLIVEDEN AT GRANGE | $7,600,000 | 2842 | $2,674 | $9,935,000 | 39281 | 14.8 | -$2,335,000 | -23.50% | -1.80% | New Sale to Resale | Freehold |
| THE ARCADIA | $7,700,000 | 7503 | $1,026 | $10,000,000 | 40401 | 11.9 | -$2,300,000 | -23.00% | -2.20% | Resale to Resale | Leasehold |
| N.A. (8 Nassim Hill) | $9,790,000 | 4209 | $2,326 | $12,000,000 | 40407 | 11.5 | -$2,210,000 | -18.40% | -1.70% | New Sale to Resale | Freehold |
| MARINA COLLECTION | $3,700,000 | 2185 | $1,693 | $5,877,650 | 41192 | 9.7 | -$2,177,650 | -37.00% | -4.70% | Resale to Resale | Leasehold |
| CLIVEDEN AT GRANGE | $7,700,000 | 2842 | $2,710 | $9,864,600 | 39288 | 14.9 | -$2,164,600 | -21.90% | -1.70% | New Sale to Resale | Freehold |
| HELIOS RESIDENCES | $3,950,000 | 1668 | $2,368 | $6,110,700 | 41158 | 9.5 | -$2,160,700 | -35.40% | -4.50% | Resale to Resale | Freehold |
| HELIOS RESIDENCES | $3,950,000 | 1701 | $2,323 | $6,037,485 | 39497 | 14.2 | -$2,087,485 | -34.60% | -2.90% | Sub Sale to Resale | Freehold |
| HELIOS RESIDENCES | $2,800,000 | 1281 | $2,186 | $4,856,600 | 41473 | 8.5 | -$2,056,600 | -42.30% | -6.30% | Resale to Resale | Freehold |
| HELIOS RESIDENCES | $3,980,000 | 1701 | $2,340 | $6,000,000 | 39420 | 15.0 | -$2,020,000 | -33.70% | -2.70% | New Sale to Resale | Freehold |
| CITYVISTA RESIDENCES | $5,200,000 | 2626 | $1,980 | $7,152,996 | 39267 | 15.4 | -$1,952,996 | -27.30% | -2.10% | New Sale to Resale | Freehold |
| CITYVISTA RESIDENCES | $4,950,000 | 2626 | $1,885 | $6,827,600 | 39381 | 14.7 | -$1,877,600 | -27.50% | -2.20% | New Sale to Resale | Freehold |
| THE OCEANFRONT @ SENTOSA COVE | $6,730,000 | 3025 | $2,225 | $8,600,000 | 40486 | 11.4 | -$1,870,000 | -21.70% | -2.10% | Sub Sale to Resale | Leasehold |
| REFLECTIONS AT KEPPEL BAY | $7,308,000 | 3380 | $2,162 | $9,173,000 | 39321 | 15.0 | -$1,865,000 | -20.30% | -1.50% | New Sale to Resale | Leasehold |
| SEASCAPE | $4,280,000 | 2164 | $1,978 | $5,924,100 | 40296 | 12.3 | -$1,644,100 | -27.80% | -2.60% | New Sale to Resale | Leasehold |
| HELIOS RESIDENCES | $2,838,000 | 1281 | $2,216 | $4,481,500 | 41235 | 9.3 | -$1,643,500 | -36.70% | -4.80% | Resale to Resale | Freehold |
Here are the biggest losers by % loss:
| Project Name | Price | Size (sqft) | $PSF | Buy Price | Buy Date | Years Held | Quantum Loss | % Loss | Annualised Loss | Type of Sale | Tenure |
| HELIOS RESIDENCES | $2,800,000 | 1281 | $2,186 | $4,856,600 | 7/18/2013 | 8.5 | -$2,056,600 | -42.30% | -6.3% | Resale to Resale | Freehold |
| REFLECTIONS AT KEPPEL BAY | $5,850,000 | 3993 | $1,465 | $9,981,000 | 5/10/2007 | 15.0 | -$4,131,000 | -41.40% | -3.5% | New Sale to Resale | Leasehold |
| THE SCOTTS TOWER | $1,300,000 | 657 | $1,980 | $2,200,500 | 4/24/2013 | 9.5 | -$900,500 | -40.90% | -5.4% | New Sale to Resale | Leasehold |
| THE CLIFT | $1,400,000 | 829 | $1,689 | $2,326,400 | 7/9/2012 | 10.1 | -$926,400 | -39.80% | -4.9% | Resale to Resale | Leasehold |
| MARINA BAY SUITES | $5,000,000 | 2691 | $1,858 | $8,250,000 | 12/11/2013 | 8.7 | -$3,250,000 | -39.40% | -5.6% | New Sale to Resale | Leasehold |
| SEASCAPE | $5,900,000 | 3380 | $1,746 | $9,600,000 | 1/12/2011 | 11.8 | -$3,700,000 | -38.50% | -4.0% | New Sale to Resale | Leasehold |
| MARINA COLLECTION | $3,700,000 | 2185 | $1,693 | $5,877,650 | 10/10/2012 | 9.7 | -$2,177,650 | -37.00% | -4.7% | Resale to Resale | Leasehold |
| HELIOS RESIDENCES | $2,838,000 | 1281 | $2,216 | $4,481,500 | 11/22/2012 | 9.3 | -$1,643,500 | -36.70% | -4.8% | Resale to Resale | Freehold |
| BELLE VUE RESIDENCES | $4,702,000 | 3552 | $1,324 | $7,400,000 | 9/3/2012 | 9.5 | -$2,698,000 | -36.50% | -4.7% | Resale to Resale | Freehold |
| HELIOS RESIDENCES | $3,950,000 | 1668 | $2,368 | $6,110,700 | 9/6/2012 | 9.5 | -$2,160,700 | -35.40% | -4.5% | Resale to Resale | Freehold |
| THE MARQ ON PATERSON HILL | $13,380,000 | 3089 | $4,331 | $20,542,400 | 11/18/2011 | 10.8 | -$7,162,400 | -34.90% | -3.9% | New Sale to Resale | Freehold |
| HELIOS RESIDENCES | $3,950,000 | 1701 | $2,323 | $6,037,485 | 2/19/2008 | 14.2 | -$2,087,485 | -34.60% | -2.9% | Sub Sale to Resale | Freehold |
| MARINA COLLECTION | $5,050,000 | 3412 | $1,480 | $7,700,000 | 5/26/2010 | 12.5 | -$2,650,000 | -34.40% | -3.3% | New Sale to Resale | Leasehold |
| HELIOS RESIDENCES | $3,058,000 | 1313 | $2,329 | $4,623,000 | 8/6/2007 | 15.3 | -$1,565,000 | -33.90% | -2.7% | New Sale to Resale | Freehold |
| HELIOS RESIDENCES | $3,980,000 | 1701 | $2,340 | $6,000,000 | 12/4/2007 | 15.0 | -$2,020,000 | -33.70% | -2.7% | New Sale to Resale | Freehold |
| OUE TWIN PEAKS | $1,238,000 | 570 | $2,170 | $1,858,605 | 12/28/2016 | 5.9 | -$620,605 | -33.40% | -6.6% | Resale to Resale | Leasehold |
| HELIOS RESIDENCES | $2,800,000 | 1313 | $2,132 | $4,152,000 | 7/31/2007 | 14.9 | -$1,352,000 | -32.60% | -2.6% | New Sale to Resale | Freehold |
| THE LUMOS | $5,737,875 | 2433 | $2,359 | $8,433,000 | 8/20/2007 | 15.0 | -$2,695,125 | -32.00% | -2.5% | New Sale to Resale | Freehold |
| CLIVEDEN AT GRANGE | $5,700,000 | 2153 | $2,648 | $8,341,040 | 8/3/2007 | 14.7 | -$2,641,040 | -31.70% | -2.6% | New Sale to Resale | Freehold |
| MARINA BAY SUITES | $3,100,000 | 1593 | $1,946 | $4,506,400 | 7/9/2012 | 9.7 | -$1,406,400 | -31.20% | -3.8% | New Sale to Resale | Leasehold |
| PATERSON SUITES | $13,800,000 | 6663 | $2,071 | $20,000,000 | 11/18/2011 | 11.1 | -$6,200,000 | -31.00% | -3.3% | Resale to Resale | Freehold |
| OUE TWIN PEAKS | $1,200,000 | 549 | $2,186 | $1,714,000 | 5/17/2013 | 8.6 | -$514,000 | -30.00% | -4.0% | New Sale to Resale | Leasehold |
| GRANGE INFINITE | $5,800,000 | 2573 | $2,255 | $8,236,533 | 9/25/2007 | 14.5 | -$2,436,533 | -29.60% | -2.4% | New Sale to Resale | Freehold |
| THE SAIL @ MARINA BAY | $2,430,000 | 1313 | $1,850 | $3,450,000 | 9/25/2013 | 8.7 | -$1,020,000 | -29.60% | -4.0% | Resale to Resale | Leasehold |
| THE SAIL @ MARINA BAY | $2,550,000 | 1184 | $2,154 | $3,600,000 | 4/4/2011 | 11.3 | -$1,050,000 | -29.20% | -3.0% | Resale to Resale | Leasehold |
| VIDA | $1,080,000 | 527 | $2,048 | $1,513,000 | 1/13/2011 | 11.6 | -$433,000 | -28.60% | -2.9% | Resale to Resale | Freehold |
| ONE SHENTON | $2,560,000 | 1572 | $1,629 | $3,567,120 | 2/9/2011 | 11.2 | -$1,007,120 | -28.20% | -2.9% | New Sale to Resale | Leasehold |
| MARINA BAY SUITES | $3,808,000 | 2045 | $1,862 | $5,304,000 | 5/26/2010 | 12.5 | -$1,496,000 | -28.20% | -2.6% | New Sale to Resale | Leasehold |
| SEASCAPE | $4,280,000 | 2164 | $1,978 | $5,924,100 | 4/28/2010 | 12.3 | -$1,644,100 | -27.80% | -2.6% | New Sale to Resale | Leasehold |
| REFLECTIONS AT KEPPEL BAY | $3,860,700 | 2271 | $1,700 | $5,339,200 | 4/26/2007 | 14.9 | -$1,478,500 | -27.70% | -2.2% | Sub Sale to Resale | Leasehold |
All of this goes to show that conventional wisdom doesn’t always hold true. The property market – especially one as dynamic as Singapore – can be unpredictable.
Sellers can still make losses in a booming market; and conventional beliefs about holding periods and sub sales can be proven wrong.
ALSO READ: Beyond 2022: How Singapore's development will affect the property market (Sembawang and Woodlands)
It’s possible that some, or perhaps even most, of these losses were due to exceptional circumstances: the death of a co-owner, drastic changes in income, or selling between family members (these may be at a steep discount, such as if someone sells to a sibling or child).
But it’s not impossible that it can happen, and this also means hope for home buyers. Don’t stop looking, because you can see here that at least 733 buyers managed to transact at a lower price – even in the 2022 property market.
This article was first published in Stackedhomes.