

Are BTOs still as profitable today? Here's how BTO profits have changed since 2002

PHOTO: Stackedhomes
It is a commonly debated topic: Should BTO flat owners be allowed to profit? Or should public housing be kept strictly as a way to house Singaporeans – and not as an “investment” vehicle.
For better or worse, BTO flats have been said to be a “pot of gold” that can be unlocked after the five-year MOP. Just look at those lucky owners who managed to purchase the Pinnacle@Duxton as a BTO flat, some of which would easily be sitting on a cool $800-$900k profit today.
And it’s why aside from the fact that it is the most affordable type of housing in Singapore, many buyers (first-timers and second-timers alike) wait with bated breath for the BTO exercises because these flats would be brand new (and we know Singaporeans love new things when it comes to new launches).
Love it or hate it, there’s no denying that there are many who see BTOs as a way to “make money”, even though this type of behaviour is highly discouraged.
So with that in mind, how exactly have BTO prices and profits changed over the years, and has this “pot of gold” Singaporeans so desire diminished, remained the same, or increased over the years? We’ll find out by checking out the data of past BTO prices as well as resale flat prices at the time of their first MOP.
One thing’s for sure, BTO prices have gone up and it’s probably why some people who purchased an HDB before gawk at today’s BTO prices since they could cost more than the new resale flats of yesteryears. Here’s a breakdown of the BTO launch year and their type of estate. Do note that these are prices before grants.
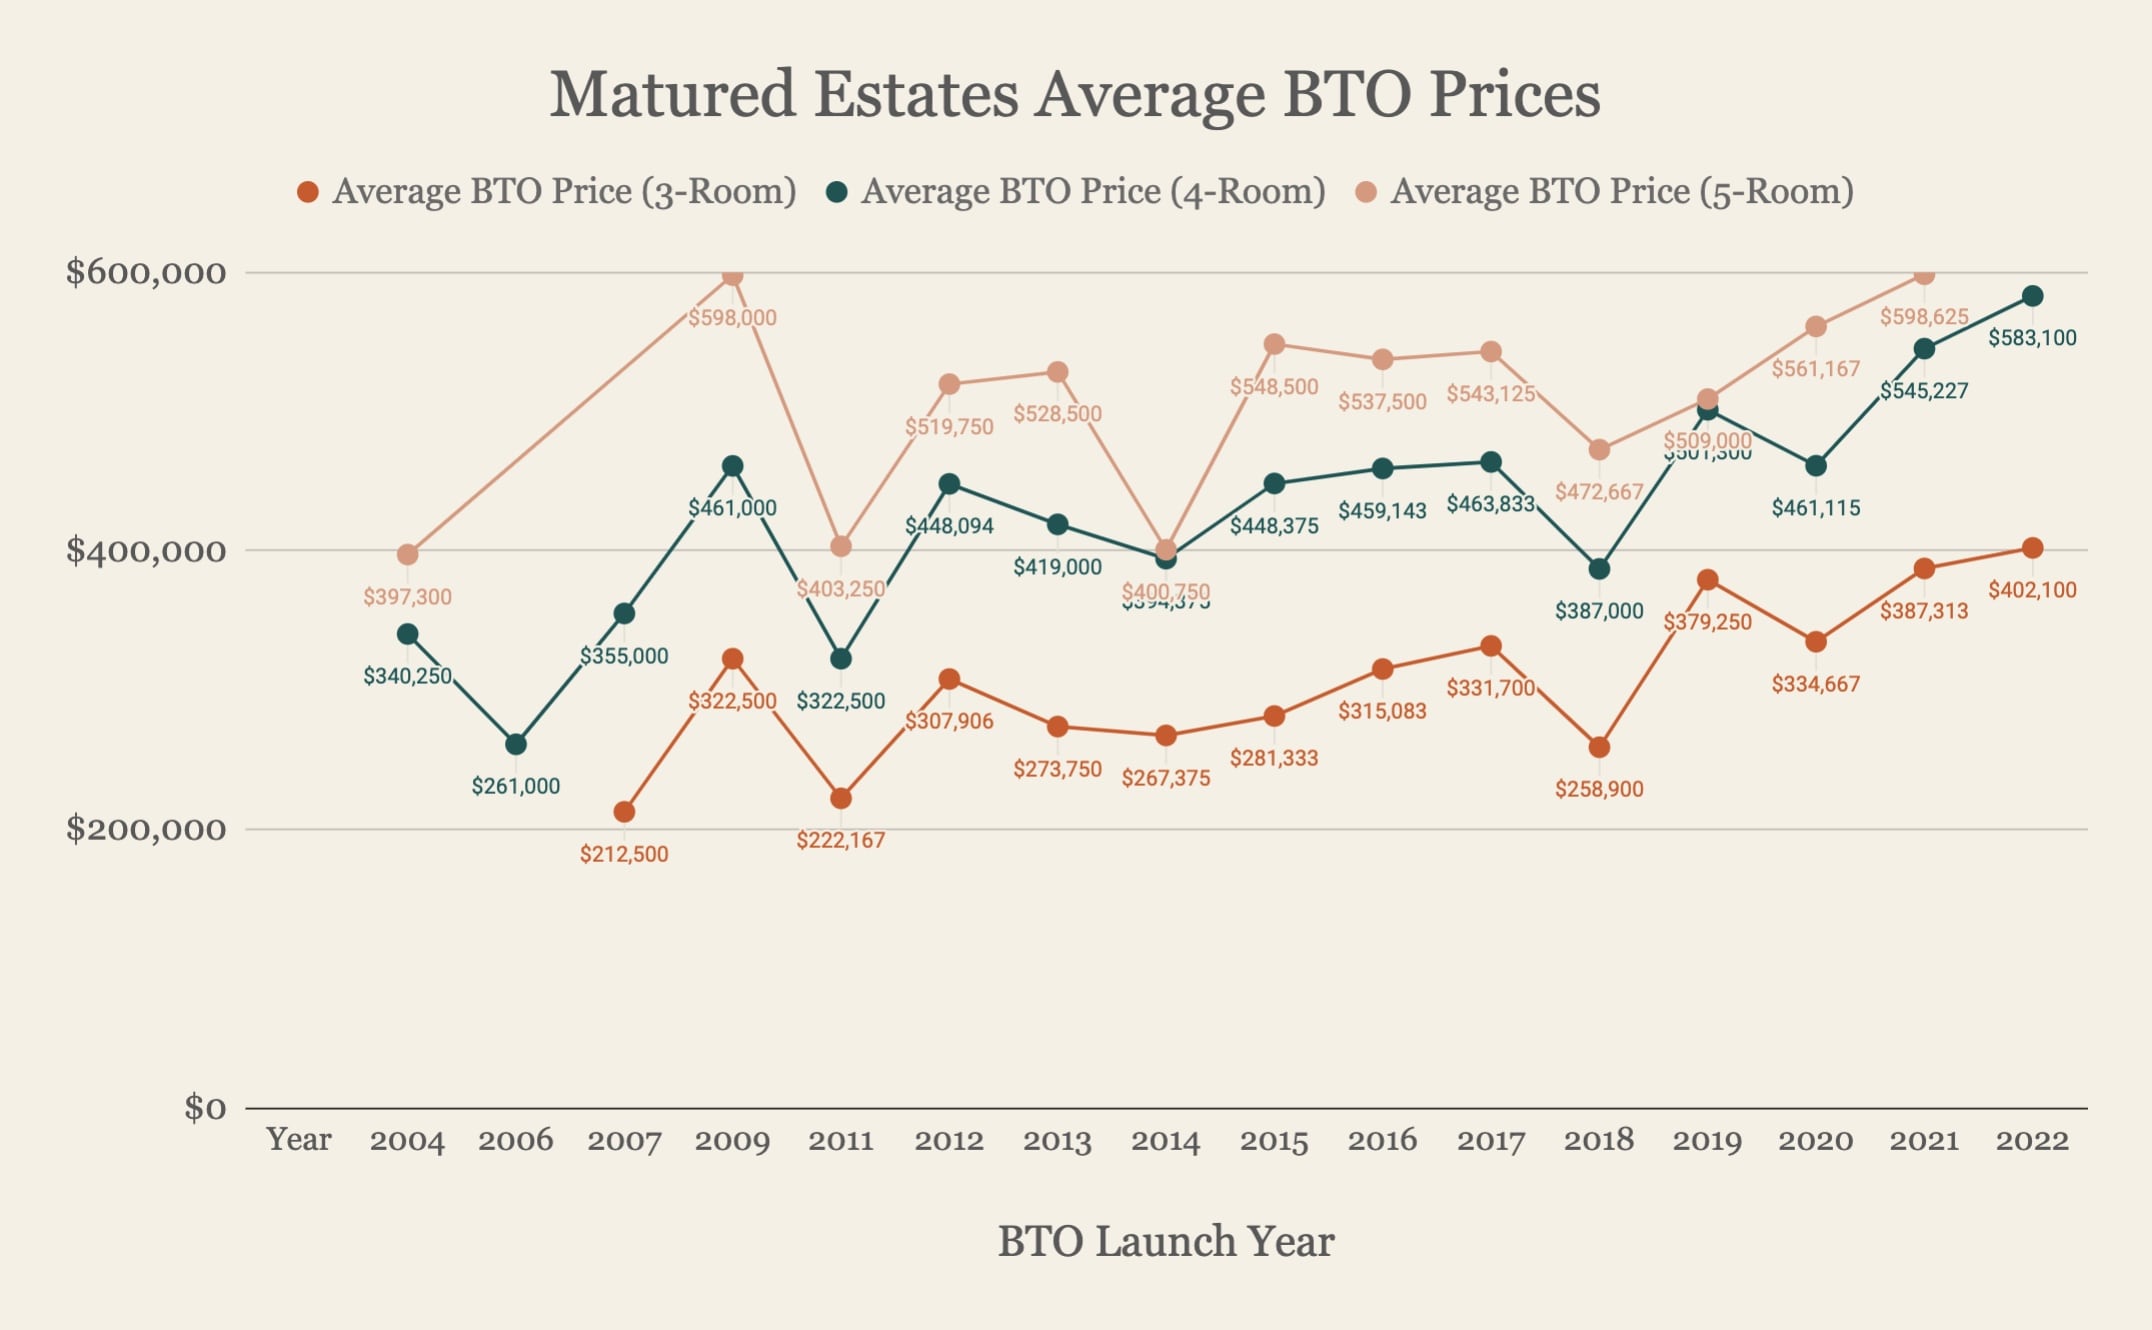
To be sure, “mature estate” is a tricky term. There’s no official definition, but a common guideline is that the estate is at least 20 years old. But this definition is so loose and probably can’t hold water at some point given that Punggol would be 20 years old in a couple of years.
The HDBs located in the Mature estate of Tampines cannot be expected to fetch the same prices as those in the Mature estate of Bukit Merah. Prices are more affected by the location rather than the status which can explain why prices can fall in prices in-between years.
Moreover, the HDB releases far fewer mature projects. The uneven distribution of mature BTOs across different locations each year has resulted in choppiness in prices. Three out of five mature projects launched in 2018 were in Tampines, while two out of five in Tampines were launched the next year. Another two out of five mature BTOs launched in 2019 were in the Kallang/Whampoa estate which saw much higher prices than other mature BTOs.
However, the overall trend here is obvious: Prices have seen a steady increase since 2004 with the occasional dips likely due to location-specific factors more than the market cycle. Today, mature BTOs have reached an all-time high which is likely why some people cannot believe that BTOs can cost around $600,000 today.

As for non-mature BTOs, they display a much more consistent increase than mature BTOs. This is likely due to the fact that volume is not just higher, but the same non-mature estates tend to be launched over the years, resulting in fewer variances in prices – Punggol and Sengkang are two estates of note here.
There are two time periods to note here that illustrate how prices of BTOs do not move in line with resale flat prices. This is between 2007 to 2013, and 2014 to 2019.
Here’s a look at 4-room BTO prices from 2007 to 2013:
| Type Of Estate | 2007 4-Room BTO Prices (Average) | 2013 4-Room BTO Prices (Average) | per cent Change |
| Mature | $355,000 | $419,000 | 18 per cent |
| Non-Mature | $209,938 | $296,659 | 41 per cent |
The change in prices over this seven-year period was just 18 per cent for mature estates and a much higher 41 per cent for non-mature estates. These increases may sound like a lot, but it’s not anywhere near the increase in resale HDB prices over the same period.

According to the HDB resale price index, prices on average increased by 90 per cent between 2007-2013!
We can also index BTO prices (both mature and non-mature prices) and compare them with the resale price index to see how it fares:

As you can see, BTO prices initially went up but did not follow through with the highs of resale prices. This sort of “caught up” later when BTO prices stagnated while HDB resale prices cooled.
This is not an apples-to-apples comparison though. Resale HDBs have the benefit of being available almost immediately, and what you see is what you get. On the other hand, BTOs have a waiting time of about four years to build (some of which have been longer due to the pandemic).
Still, the disparity in the run-up of prices can leave you scratching your head since a significant portion of the BTO cost is attributed to land prices.
If the resale value goes up and the market value of the land follows suit, shouldn’t BTO prices go up accordingly?
In my opinion, it’s likely that a larger discount rate to the market value was applied while the property market moved to cushion the blow to first-time home buyers. After all, HDB is social housing, and raising the launch prices in line with market rates could cause discontent.
And since the HDB sets the price, it could be very unfair for subsequent batches of BTOs to cost LESS than their predecessors as the previous buyers would make a ruckus out of it since they would have to compete with sellers that had a lower cost price, to begin with.
That could explain why BTO launch prices remained pretty much consistent from 2014 to 2019 despite the fact that the HDB resale market cooled and subsequently stagnated. Ultimately, the BTO pricing strategy paid off as the market cooled, allowing BTO prices to “catch up” with resale prices in that sense. Today, we’re seeing an increase in both resale flat prices and BTO launch prices.
Now that you’ve seen the context of how BTO prices have changed over the years, we can move on to the next and probably most people’s point of interest:
Some points to note about the data:
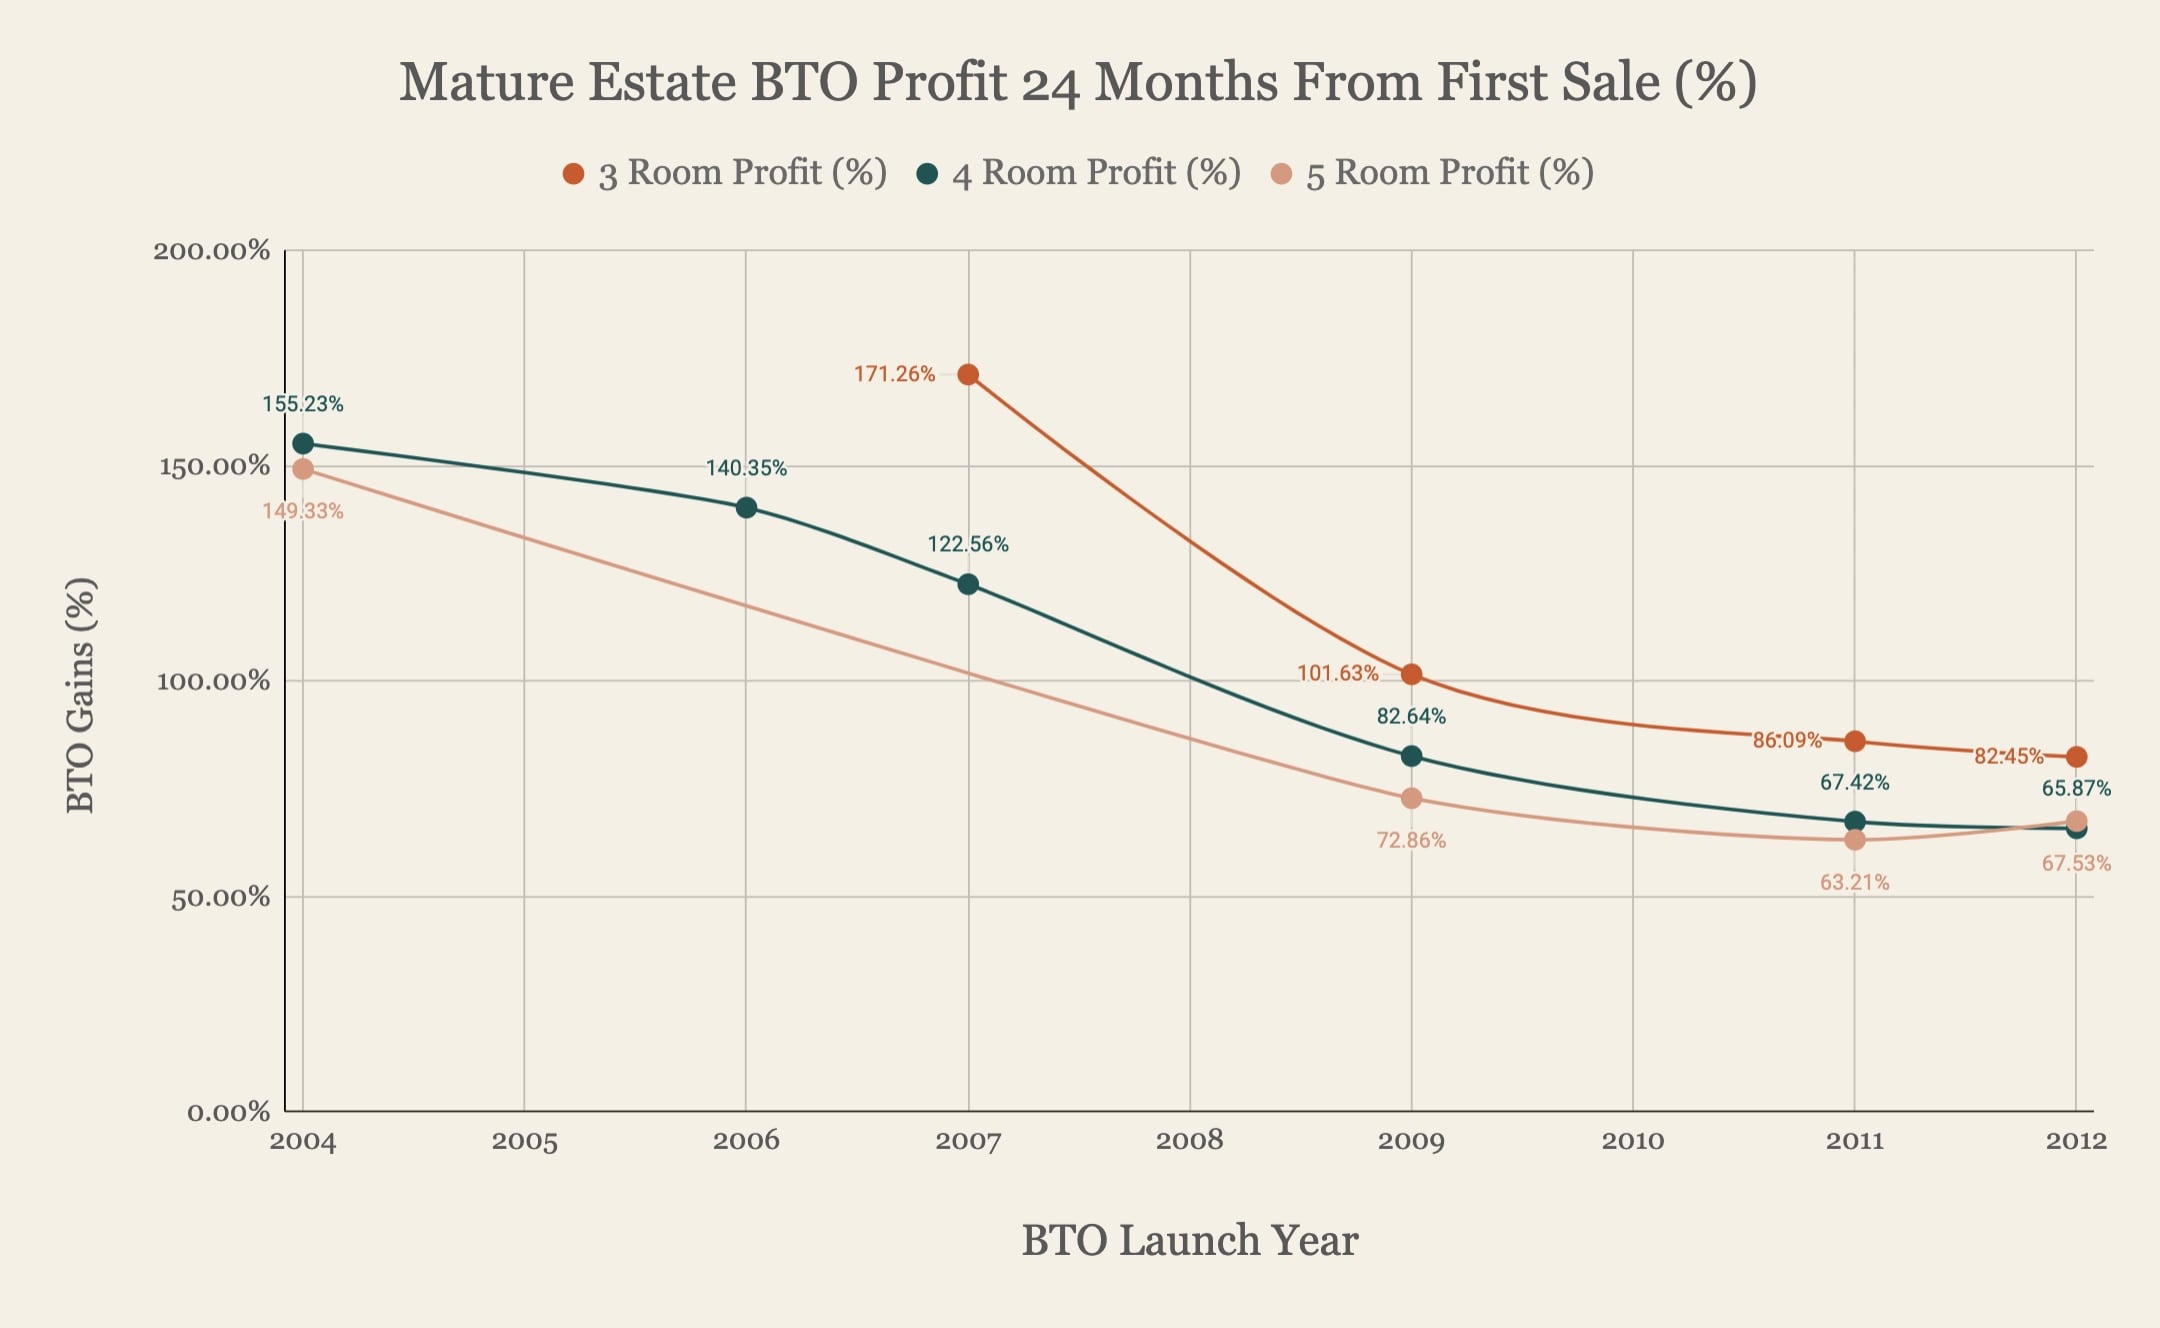
The chart paints an obvious picture: The profits for mature BTOs have fallen over the years in terms of the return on “investment”. In 2004, 2006, and 2007, those who purchased a BTO could see returns of over 100 per cent for four-room flats but this fell to 66 per cent in 2012 for four-room flats.
Here are the profits in terms of quantum:
| BTO Launch Year | 3-Room BTO Profit ($) | 4-Room BTO Profit ($) | 5-Room BTO Profit ($) |
| 2004 | – | $528,167 | $593,270 |
| 2006 | – | $366,322 | – |
| 2007 | $363,937 | $435,099 | – |
| 2009 | $327,767 | $380,964 | $435,676 |
| 2011 | $237,129 | $312,859 | $255,104 |
| 2012 | $292,559 | $356,636 | $462,497 |
No prizes for guessing why the launch in 2004 bagged over half a million in profits – it’s The Pinnacle@Duxton in case you’re wondering. I consider that Central Area project to be more of an exception than the norm, and you can clearly see this in the lower profits that buyers of Mature estate BTOs made up till 2012. I suppose The Pinnacle@Duxton truly earned the title of being a “jackpot HDB”.
Generally, the overall profits in terms of absolute dollars have fallen since 2004, with the exception of the launch from 2012.
Does this necessarily mean that those who purchased BTO flats back then had it much better from a profit standpoint?
Not necessarily! As highlighted earlier, the resale market went up by 90 per cent from 2007 to 2013. Launches in 2004 likely sold around 2013. Thus, the high pre-2008 gains bake in this resale price increase too.
The decline could also be explained by the slow but steady decline in resale HDB prices between 2015 and 2020.
Other observations:
Due to the lack of transactions or pricing data, only 15 mature estate BTOs were analysed.
Overall, you could say that the phenomenal returns these BTO owners saw pre-2008 can only be repeated once more if the resale market moves in the same magnitude and that would be a worrisome matter on its own.

It’s the same story if we look at non-mature BTO launches. In general, BTO profits have fallen over time from a high of 291 per cent and 232 per cent returns to around 113 per cent and 72 per cent for a three and 4-room flat respectively.
The stellar gains in the early 2000s could be largely attributed to the run-up and property prices between 2007-13 and the steady decline in profits could also be explained by the steady increase in BTO prices over the years, coupled with a sluggish resale market between 2015 to 2020.
If you observe the years 2008 and 2009, you’ll notice that the returns bucked the trend and saw a slight increase in returns. This could be explained by the lower average BTO prices of non-mature estates during this period.
The year 2012 also saw a very slight increase in profit, likely due to the very similar BTO costs between 2011 and 2012 coupled with the fact that 2021 saw HDB prices edging upwards.
Here are the profits in terms of quantum:
| BTO Launch Year | 3-Room BTO Profit ($) | 4-Room BTO Profit ($) | 5-Room BTO Profit ($) |
| 2001 | – | $251,545 | $208,907 |
| 2002 | – | $330,729 | – |
| 2003 | – | $296,615 | – |
| 2004 | $289,318 | $390,603 | – |
| 2005 | $261,652 | $327,522 | – |
| 2006 | $246,087 | $264,044 | – |
| 2007 | $220,114 | $230,054 | $399,500 |
| 2008 | $178,243 | $190,973 | $209,709 |
| 2009 | $183,958 | $191,906 | $233,264 |
| 2010 | $205,243 | $212,946 | $281,209 |
| 2011 | $199,008 | $255,454 | $320,921 |
| 2012 | $221,369 | $267,129 | $333,526 |
The absolute profit BTO buyers of Non-mature estates have made has also fallen up until around those who bought in 2008/09, after which profits steadily increased till 2012. While profits in absolute terms did go up during this period, the actual returns in percentages only increased slightly due to the increasing cost of Non-mature estates as pointed out earlier.
It’s definitely hard to say whether BTO profits for those who bought from 2013 will edge upwards back to the three-digit category of yesteryears, but here’s a fun little exercise to see what resale prices have to be in the MOP year (around 10 years from launch) for these BTO owners to sell at double their BTO price.
Mature BTO average prices
| Year | Average 3-Room BTO | Average 4-Room BTO | Average 5-Room BTO |
| 2013 | $273,750 | $419,000 | $528,500 |
| 2014 | $267,375 | $394,375 | $400,750 |
| 2015 | $281,333 | $448,375 | $548,500 |
| 2016 | $315,083 | $459,143 | $537,500 |
| 2017 | $331,700 | $463,833 | $543,125 |
| 2018 | $258,900 | $387,000 | $472,667 |
| 2019 | $379,250 | $501,300 | $509,000 |
| 2020 | $334,667 | $461,115 | $561,167 |
| 2021 | $387,313 | $545,227 | $598,625 |
| 2022 | $402,100 | $583,100 | NIL |
Making 100 per cent returns would mean Mature HDB prices have to hit the following:
| Year | Projected 3-Room Resale Price | Projected 4-Room Resale Price | Projected 5-Room Resale Price |
| 2023 | $547,500 | $838,000 | $1,057,000 |
| 2024 | $534,750 | $788,750 | $801,500 |
| 2025 | $562,667 | $896,750 | $1,097,000 |
| 2026 | $630,167 | $918,286 | $1,075,000 |
| 2027 | $663,400 | $927,667 | $1,086,250 |
| 2028 | $517,800 | $774,000 | $945,333 |
| 2029 | $758,500 | $1,002,600 | $1,018,000 |
| 2030 | $669,333 | $922,231 | $1,122,333 |
| 2031 | $774,625 | $1,090,455 | $1,197,250 |
| 2032 | $804,200 | $1,166,200 |
Non-Mature BTO average prices
| Year | Average 3-Room BTO | Average 4-Room BTO | Average 5-Room BTO |
| 2013 | $184,375 | $296,659 | $374,176 |
| 2014 | $182,875 | $287,000 | $381,750 |
| 2015 | $182,286 | $295,625 | $395,400 |
| 2016 | $179,429 | $283,313 | $365,667 |
| 2017 | $184,250 | $293,214 | $379,929 |
| 2018 | $191,786 | $289,222 | $375,250 |
| 2019 | $217,273 | $321,455 | $434,682 |
| 2020 | $202,563 | $313,875 | $427,929 |
| 2021 | $234,563 | $371,500 | $448,813 |
| 2022 | $230,000 | $346,000 | $472,250 |
Making 100 per cent returns would mean Non-Mature HDB prices have to hit the following:
| Year | Projected 3-Room Resale Price | Projected 4-Room Resale Price | Projected 5-Room Resale Price |
| 2023 | $368,750 | $593,318 | $748,353 |
| 2024 | $365,750 | $574,000 | $763,500 |
| 2025 | $364,571 | $591,250 | $790,800 |
| 2026 | $358,857 | $566,625 | $731,333 |
| 2027 | $368,500 | $586,429 | $759,857 |
| 2028 | $383,571 | $578,444 | $750,500 |
| 2029 | $434,545 | $642,909 | $869,364 |
| 2030 | $405,125 | $627,750 | $855,857 |
| 2031 | $469,125 | $743,000 | $897,625 |
| 2032 | $460,000 | $692,000 | $944,500 |
If you look at the projected prices at 100 per cent of the average BTO price, you’ll realise that these prices aren’t that crazy. Today, we’re already seeing 4-room flat prices hitting $500,000+ in non-mature estates like Punggol:
| TOWNS | 3-ROOM | 4-ROOM | 5-ROOM |
| ANG MO KIO | $350,000 | $475,000 | $702,500 |
| BEDOK | $335,000 | $450,000 | $640,000 |
| BISHAN | * | $629,000 | $810,000 |
| BUKIT BATOK | $345,000 | $480,000 | $650,000 |
| BUKIT MERAH | $402,500 | $750,000 | $840,000 |
| BUKIT PANJANG | $354,000 | $455,000 | $564,500 |
| BUKIT TIMAH | * | * | * |
| CENTRAL | $430,000 | $811,000 | * |
| CHOA CHU KANG | $391,500 | $470,000 | $567,400 |
| CLEMENTI | $380,000 | $703,000 | $818,000 |
| GEYLANG | $301,000 | $530,000 | $856,500 |
| HOUGANG | $350,000 | $487,000 | $586,000 |
| JURONG EAST | $339,000 | $450,000 | $567,500 |
| JURONG WEST | $330,000 | $440,000 | $538,900 |
| KALLANG/WHAMPOA | $360,000 | $755,000 | $784,400 |
| MARINE PARADE | * | * | * |
| PASIR RIS | * | $490,000 | $600,000 |
| PUNGGOL | $411,000 | $520,000 | $600,000 |
| QUEENSTOWN | $360,000 | $820,000 | $952,000 |
| SEMBAWANG | * | $466,500 | $534,400 |
| SENGKANG | $406,000 | $510,000 | $560,000 |
| SERANGOON | $366,500 | $492,500 | $658,000 |
| TAMPINES | $380,000 | $498,000 | $615,000 |
| TOA PAYOH | $320,000 | $622,500 | $875,000 |
| WOODLANDS | $341,500 | $450,000 | $530,000 |
| YISHUN | $360,000 | $450,000 | $582,500 |
Source: HDB
Note: Asterisks (” * “) refer to cases where there are less than 20 resale transactions in the quarter for the particular town and flat type. The median prices of these cases are not shown as they may not be representative – HDB.
These are the median resale flat prices too, which takes into account older HDBs, so recently MOP HDBs would cost more.
Judging from this, I would not be surprised to see BTO buyers cash in a larger amount from their purchase in subsequent years should the resale market continue in its trajectory.
Do you think this is a realistic view of the average resale flat prices in Singapore in the years to come? Keen to hear your thoughts in the comments below!
BTO profits are not what they used to be. It’s common to hear people say they’ve made their “first pot of gold” doubling through a BTO – but this really applied to those who bought prior to 2008. That means the last batch of buyers that saw double their investment last sold in 2016/2017 and are probably sitting on those types of paper gains (or more) if they haven’t sold till today.
Buyers since the 2008 to 2012 launches who realised their gains did not see the same doubling of their BTO prices compared to buyers prior.
That being said, the run-up in resale flat prices today means that the returns for these buyers will likely increase. A look at the rising resale flat prices today coupled with the largely stagnant BTO costs between 2013 and 2017 could also see such buyers get a better return on their investment compared to those who bought prior.
At the end of the day, BTOs still remain true to the common saying of being a “pot of gold” that Singaporeans have the privilege of unlocking.
And if you do consider the “investment” from a leveraged standpoint (most people do not buy their BTOs in cash) PLUS add on the grants you may have received, then you really cannot do as well in the property market as with BTOs.
After all, that sacrifice of waiting for four years to move has to come with some form of reward. The question is whether or not this reward will continue to be “worth it”. And from our analysis, it seems to have paid off handsomely for those who purchased prior to 2008, pretty good for those in 2008 to 2012, and could very well continue to do for those who purchased from 2013 onwards if prices stay where they are or increase.
For more on this issue as it develops, follow us on Stacked so we can update you. We also provide in-depth reviews of new and resale homes alike, in the Singapore private property market.
This article was first published in Stackedhomes.