Top electric vehicle ETFs to consider in 2022

PHOTO: Pexels
We have seen rapidly increasing adoption of Electric Vehicles (EVs) worldwide and EVs emerging as practical transport solutions in recent times. Arguably, this dare I say, the EV revolution has been pushed on by the efforts of Tesla and other automakers.
Not to mention the worsening climate crisis, which has seen governments worldwide trying to reduce our reliance on fossil fuels and has sped up the transition to EVs.
For example, Germany plans to accommodate 10 million EVs by 2030. By 2030, the Chinese Government is targetting that 40 per cent of all vehicles sold in China will be electric.
Closer to home, the Singapore Government aims to phase out Internal Combustion Engine (ICE) vehicles and have all vehicles run on cleaner energy by 2040.
And according to leading market research firm Mordor Intelligence’s Electric Vehicle Market — Growth Trends, Covid-19 Impact And Forecast (2022 to 2027) report:

Mordor reported that the "electric vehicle market was valued at US$370.86 billion (S$504 billion) in 2021, and it is expected to reach $1,298.32 billion by 2027, growing at a compound annual growth rate of 23.35 per cent over the forecast period (2022 to 2027).
"Factors such as the increasing cost of fuel and the government initiatives across different geographies to increase awareness about EVs are expected to promote the usage of electric vehicles over the forecast period. Infrastructure for charging stations continues to expand. Countries like China continue to lead the passenger vehicles and urban buses market due to a well-established supply chain for batteries and Traction Motors.
"The Asia-Pacific region is expected to witness the fastest growth, followed by Europe and North America. The automotive industry in countries such as China, India, Japan, and South Korea is inclined toward innovation, technology, and advanced electric vehicle development.
"The increasing demand for reducing carbon emissions and developing more advanced and fast-charging stations is expected to propel the growth of electric vehicles during the forecast period."
If you are interested in investing in the fast-growing EV sector, this list of Exchange Traded Fund (ETFs) might interest you.
Here’s all you need to know!
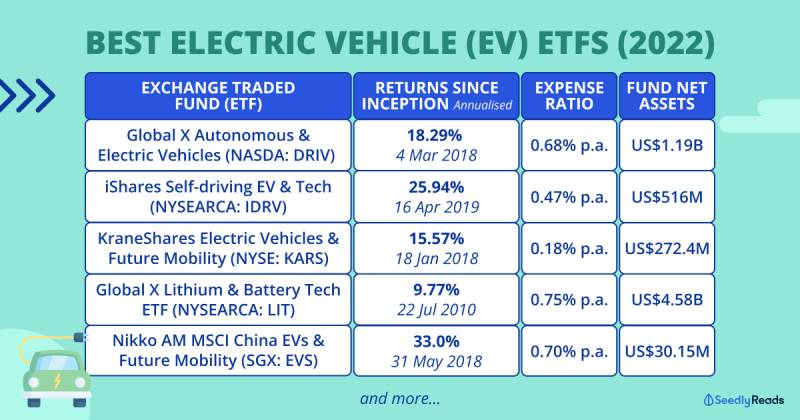
| ETF | Total expense ratio (p.a.) | Returns since inception (average annualised) | Fund's net assets |
|---|---|---|---|
| Global X Autonomous & Electric Vehicles | 0.68 per cent | 18.29 per cent (March 4, 2018) | $1.19 billion |
| iShares Self-driving EV & Tech | 0.47 per cent | 25.94 per cent (April 16, 2019) | $516 million |
| KraneShares Electric Vehicles and Future Mobility | 0.18 per cent | 15.57 per cent (Jan 18, 2018) | $272.4 million |
| Global X Lithium & Battery Tech ETF | 0.75 per cent | 9.77 per cent (July 22, 2010) | $4.58 billion |
| Nikko AM MSCI China EVs & Future Mobility | 0.70 per cent | 33.0 per cent* (May 31, 2018) | $30.15 million |
Before we begin, there are some essential terms you need to know.
According to Global X, "Beta measures the volatility of a fund’s price relative to the volatility in the market index and can also be defined as the percentage change in the price of the fund given a one per cent change in the market index. A beta below one suggests that the fund was less volatile than the market benchmark."
The standard deviation of a stock’s returns represents the Chinese concept of 'risk' well. Standard deviation measures the deviation of a stock’s returns from its expected returns.
In this case, if a stock performs well in the market above its expected or historical mean, the standard deviation of the stock increases.
Hence, investors have a greater opportunity to benefit from the above-expected results.
Of course, 'danger' also lies in the sense that the stock’s performance can be much worse than what is expected.
First up, we have the Global X autonomous and electric vehicles ETF. This passively managed ETF tracks the Solactive autonomous and electric vehicles index with trades on the Nasdaq under the ticker symbol DRIV.
Here is the key information about this ETF (via Global X):
ETF’s prices as of March 13, 2022: $24.81.
This ETF is a thematic ETF that invests in companies that build and sell EVs, produce critical EV materials like lithium and cobalt, and produce components like lithium batteries
Not to mention the companies that develop autonomous vehicle software and hardware.
As such, this ETF grants you more direct exposure to the EV sector.
READ ALSO: Points to ponder before buying an electric vehicle
This ETF’s top ten holdings include:

In terms of diversification, the ETF grants investors global exposure across multiple sectors and industries:

In terms of historical performance, the ETF has done quite decently:
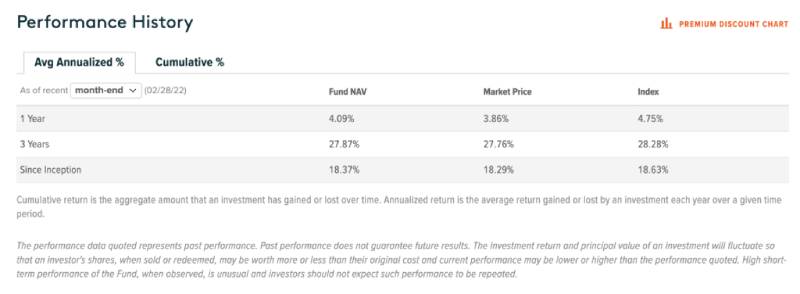
The ETF has a total return of 65.4 per cent since inception (March 4, 2018) but has fallen 20.51 per cent YTD due to soaring inflation and other geopolitical events like the US Federal Reserve’s plan to increase interest rates and Putin’s Russia invading Ukraine.
This ETF is a rather solid pick as it is well diversified across sectors and industries. The top ten holdings of this ETF are also quite well balanced out, with no one company dominating the ETF excessively.
However, the ETF is still quite US-centric as nearly two-thirds of the ETFs companies are based in the US The ETF is also quite thinly traded as it has a 30-day median bid-ask spread of 0.11 per cent and a relatively high expense ratio of 0.68 per cent.
Next up, we have the iShares Self-Driving EV and Tech ETF.
According to iShare, “the iShares Self-Driving EV and Tech ETF seeks to track the investment results of an index composed of developed and emerging market companies that may benefit from growth and innovation in and around electric vehicles, battery technologies and autonomous driving technologies.”
Here is the key information about this ETF:
ETF’s price as of March 13, 2022: $41.91.
With this ETF, you will be investing in companies at the cutting edge of self-driving and electric vehicle (EV) innovation.
The ETF will also grant you exposure to global companies along the entire value chain of self-driving and EV industries across sectors and geographies.
This ETF’s top ten holdings include:

The IDRV ETF’s top five holdings are similar to DRIV with Apple, Toyota Motor Corp, Qualcomm, Intel and Alphabet. However, IDRV is more concentrated, allocating higher weightage to the top ten holdings.
In terms of diversification, the ETF grants investors global exposure across multiple sectors and industries:

Also, here is the annualised performance of the ETF:

However, the ETF is up 61.69 per cent since its inception (April 16, 2019) but has fallen 24.38 per cent YTD due to soaring inflation and other geopolitical events like the US Federal Reserve’s plan to increase interest rates and Putin’s Russia invading Ukraine.
All things considered, DRIV and IDRIV are somewhat similar.
But, one of the main differences between the ETFs is the expense ratio, as IDRV’s expense ratio is 0.47 per cent compared to DRIV’s 0.68 per cent.
Alternatively, you might want to consider the KraneShares Electric Vehicles and Future Mobility ETF.
Here is the key information about the ETF:
ETF’s price as of March 13, 2022: $35.43.
According to KraneShares, "KARS is benchmarked to the Bloomberg EV index, which provides exposure to companies engaged in producing electric vehicles and/or their components. The index includes issuers engaged in the electric vehicle production, autonomous driving, shared mobility, lithium and/or copper production, lithium-ion/lead-acid batteries, hydrogen fuel cell manufacturing, and electric infrastructure businesses."
In other words, the ETF attempts to track the entire EV industry from lithium mining to battery and vehicle production.
READ ALSO: How the conflict in Ukraine will affect drivers in Singapore
Investing in this ETF grants you exposure to:
These are the ETFs top ten holdings:
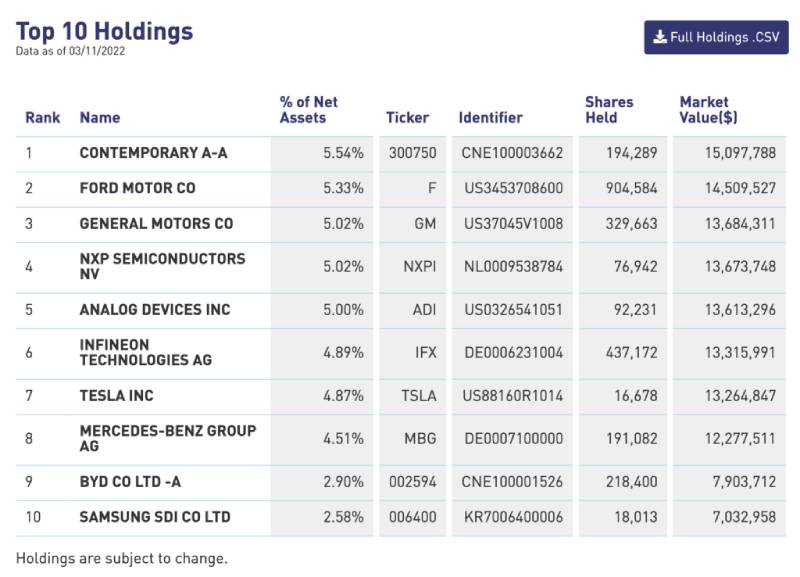
The ETF’s top holdings include Contemporary Amperex Technology which primarily produces lithium-ion batteries. They’re also quite a few legacy automakers like Ford, General Motors and Mercedes Benz.

Also, here is information about the ETF’s performance:
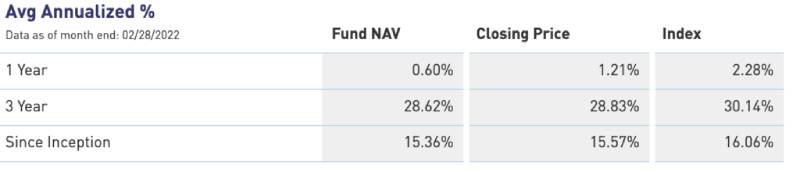
The ETF has a total return of 40.48 per cent since inception (18 Jan 18, 2018) but has fallen 25.88 per cent YTD due to soaring inflation and other geopolitical events like the US Federal Reserve’s plan to increase interest rates and Putin’s Russia invading Ukraine.
All things considered, KARS is the ETF to consider if you want more exposure to China’s EV sector.
Next up, we have the Global X lithium and battery tech ETF.
This ETF is not a direct play on the whole EV sector. Instead, it grants investors exposure to the complete lithium cycle from mining and refining the metal through battery production.
This commodity is absolutely vital to the EV industry as almost all EVs use lithium to make their batteries.
Not to mention that the ETF tracks the performance, before fees and expenses, of the Solactive global lithium index.
Here is the key information about the ETF:
ETF’s price as of March 13, 2022: $68.89.
Here are the ETF’s top ten holdings:

In terms of diversification, LIT is more concentrated as the Materials Sector makes up close to half of the ETF.
The ETF is also quite China-centric as well.
Here’s more on the ETF’s performance. There is more data as this ETF was incepted in 2010.

The ETF has a total return of 114.08 per cent since inception (July 22, 2010) but has fallen 19.83 per cent YTD due to soaring inflation and other geopolitical events like the US Federal Reserve’s plan to increase interest rates and Putin’s Russia invading Ukraine.
Note that this ETF will be more volatile as it will be affected by the cyclical pricing of commodities.
Last but not least, we have the Nikko AM MSCI China EVs & Future Mobility ETF.
Here is the key information about the ETF:
ETF’s Price as of March 13, 2022: $0.81.
The MSCI China EVs and future mobility ETF allows investors to participate in China’s growing EV sector.
The ETF’s investment objective is to replicate the performance of the MSCI China all shares IMI future mobility top 50 index.
Some of the companies part of the index include Contemporary Amperex Technology Co Limited, NIO, and Xpeng.
The ETF will be an excluded investment product.
Local investors can also use their supplementary retirement scheme to invest in the ETF instead of the default cash option.
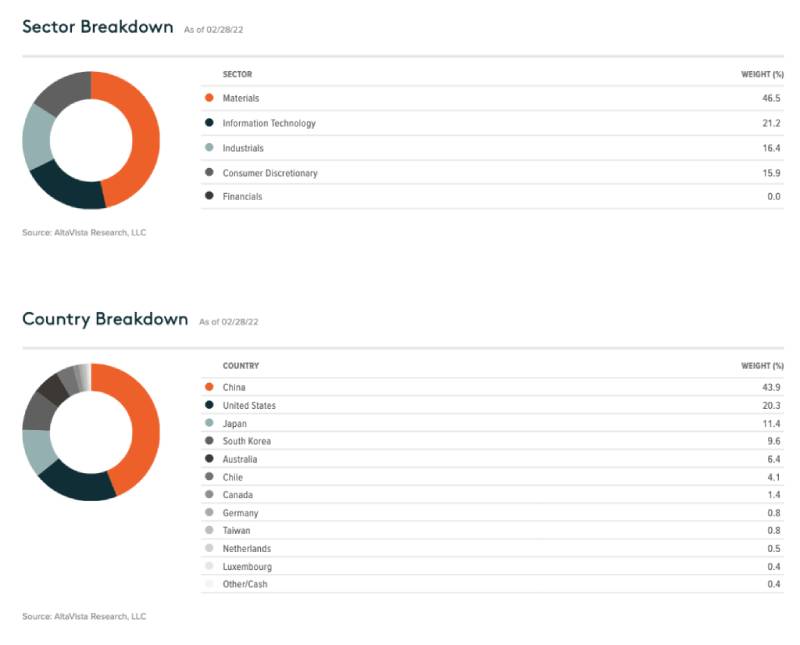
In addition, there is more information about what companies make up the index:
As you can see, the index is heavily weighted towards Chinese companies involved in the EV sector.
The biggest constituent is actually Contemporary Amperex Technology Co Limited.
For the uninitiated, the 2011 founded Chinese battery manufacturer and technology company primarily manufactures lithium-ion batteries for EVs.
The company also produces battery management systems as well as energy storage systems.
In terms of diversification, the ETF grants investors diversified exposure across multiple sectors and industries but limited global exposure:

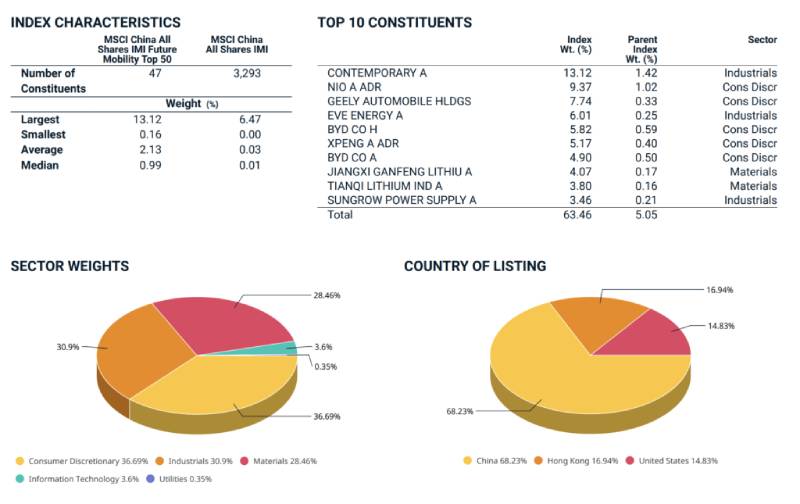
Next, up let’s take a look under the hood of the MSCI China all shares IMI future mobility top 50 index, which the ETF tracks.
The MSCI China all shares IMI future mobility top 50 index can be considered a distillation of the MSCI China all shares IMI index — a total market index that captures large, mid and small-cap representation across China A-shares, B‐shares, H‐shares, Red‐chips, and P‐chips.
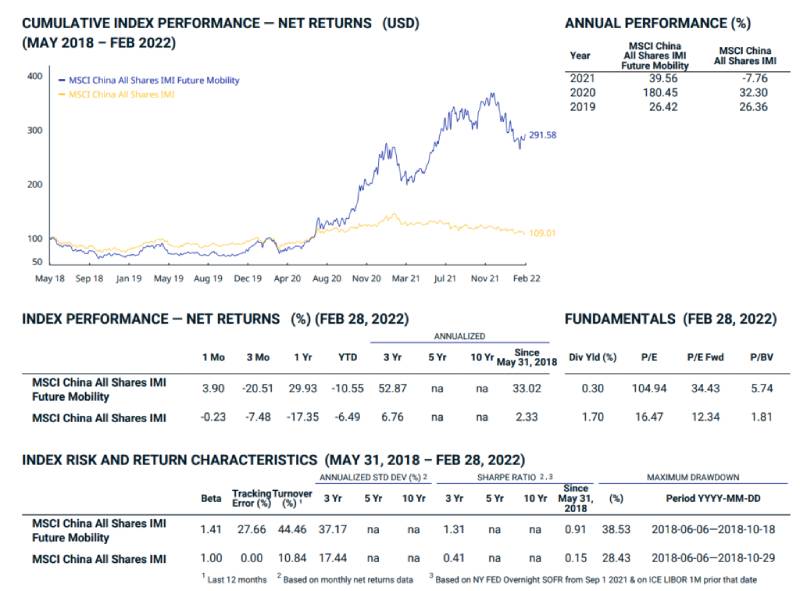
The ETF has an annualised return of 33.02 per cent since inception (May 31, 2018) but has fallen 10.55 per cent YTD due to soaring inflation and other geopolitical events like the US Federal Reserve’s plan to increase interest rates and Putin’s Russia invading Ukraine.
Disclaimer: All content is displayed for general information purposes only and does not constitute professional financial advice.
READ ALSO: Can you really save money if you switch to an electric vehicle?
This article was first published in Seedly.