Why Singapore landlords still refuse to lower rent even when units sit vacant

The reason why Singaporean landlords refuse to lower rent even when units are empty.
PHOTO: Stackedhomes

What’s different about landlords in Singapore, compared to many different countries? The answer, to me, is the degree of tolerance they have for vacancies.
Now this definitely isn’t true for every landlord, and it’s anecdotal; but I meet more landlords here who are willing to let a unit go vacant for as long as a year, rather than accept a lower rental rate.
That’s partly why Singapore’s rental market can feel oddly “sticky". Even when the market sentiment weakens, rents don’t necessarily fall very quickly.
This is partly due to the strict financing limitations we have, which tend to ensure property buyers are well capitalised: a maximum loan quantum of 75 per cent (of price or value, whichever is lower), the Total Debt Servicing Ratio, and so on.
Alternatively, as one of our readers so bluntly told me once: “If you’re rich enough to have a second property in Singapore, you’re rich enough to keep it vacant.”
Most of our landlords are unshakeable with what they consider fair rent; and if you’ve ever been a tenant, you’ll realise how quickly that reality sets in.
Most tenants in Singapore are foreigners, who probably aren’t in a position to buy due to the high prices and 60 per cent ABSD.
Even if they’re worried about their career prospects due to AI, geopolitics, etc., they really don’t have much of a choice.
As for Singaporeans waiting on their next home, or who are unable to get a flat yet, they’re often caught in a similarly awkward position.
Delays in construction, divorce proceedings, children’s school arrangements, or simply timing the sale and purchase of homes can all force them into signing a particular lease.
Quite often, they don’t have the luxury of time to look around for something more optimal.
This may explain some of the contradictions in Savills’ latest Q1 2026 rental report.
On paper, leasing activity actually increased in Q1 of this year: Residential leasing transactions rose 4per cent quarter-on-quarter to 20,862 deals.
How much shorter? We don’t have the information. But here’s the thing: a higher volume of shorter leases doesn’t always mean strong demand. Instead, it could simply reflect more frequent renewals and renegotiations.
For example, a tenant may previously have signed a two-year lease because they felt assured of stable employment, or expected to remain in Singapore for the foreseeable future.
That would naturally result in fewer lease transactions over time.
But if the same tenant is now opting for multiple shorter leases instead, leasing “activity” rises, even though the actual level of housing demand may not have changed very much.
In fact, it could suggest the opposite: Greater uncertainty about whether they’ll remain here long-term.
It may also suggest tenants are deliberately keeping their options open.
If the rental market softens later, or if economic conditions worsen, they don’t want to be locked into today’s higher rental rates for an extended period.
So the increase in leasing transactions may not necessarily reflect confidence. It may instead reflect caution, flexibility, and a growing reluctance to commit long-term.
Whilst leasing transactions increased, vacancy rates outside the CCR edged upward.
Vacancy rates in the RCR rose to 6.3 per cent, whilst OCR vacancy rates increased to 5.2 per cent. Only the CCR saw improvement, with vacancy dipping slightly to 8.2per cent.
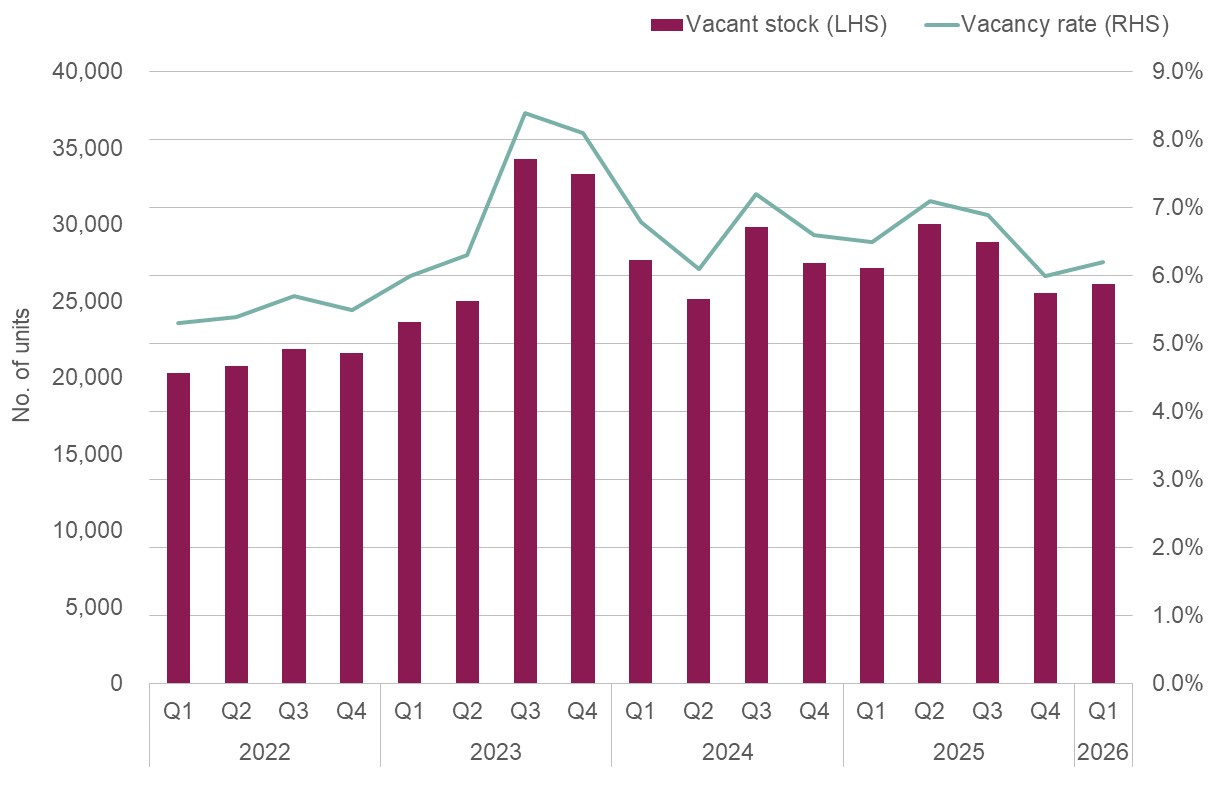
Now if rental demand were truly surging, we’d expect vacancy rates to fall dramatically across all the regions.
Instead, all we see is a slight reduction in vacancy in the CCR, whilst vacancies in the OCR and RCR actually increased.
This is likely why the experience on the ground feels “relatively subdued,” despite the higher leasing volume.
There’s a lot of activity and new leases being signed, but the general attitude points to caution.
So if you’re a landlord, and your agent looks nervous despite the new lease, this may be the reason.
As I’ve pointed out, most Singaporean landlords are (in my experience) stubborn. This seems to work especially well in the CCR or other high-rent locations.
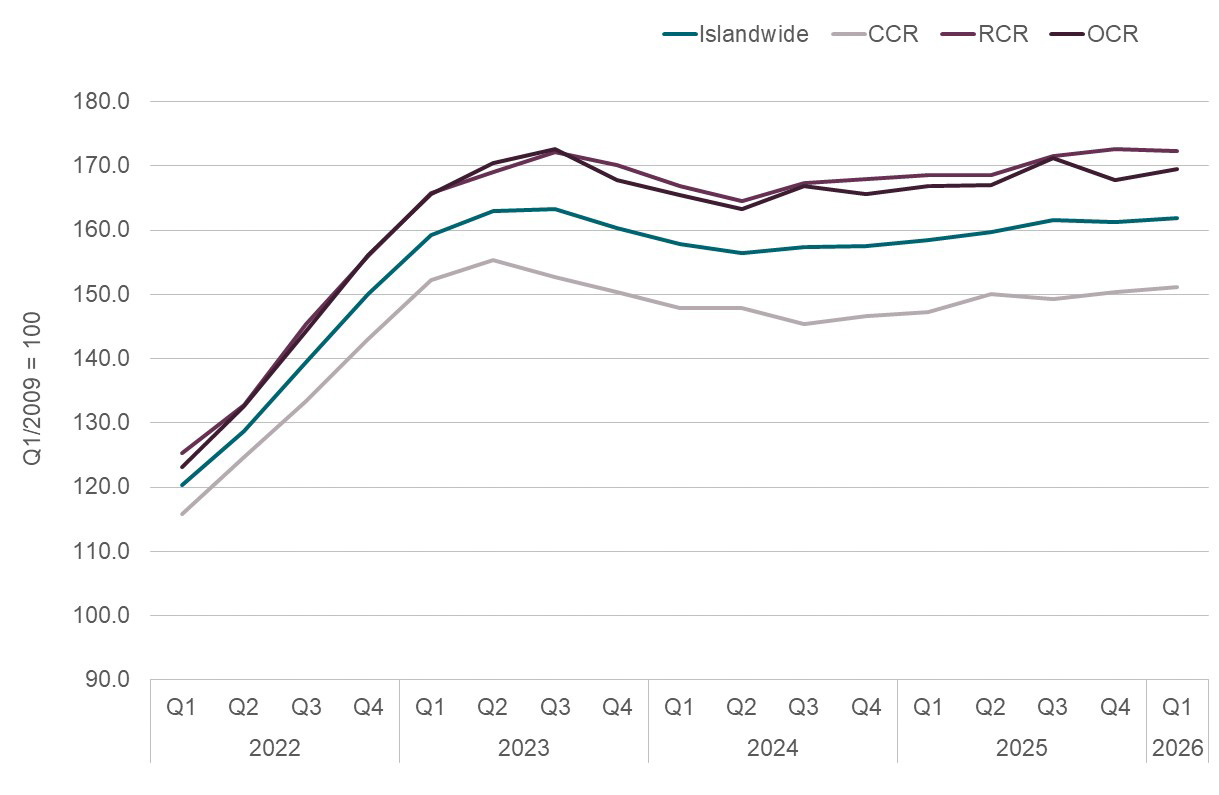
Savills’ basket of high-end non-landed homes rose 1.7 per cent quarter-on-quarter to $6.15 psf, and this is the sixth straight quarter of rental growth.
Since the last down market, which was around Q3 2024, rental rates in prime areas have now rebounded by a cumulative seven per cent.
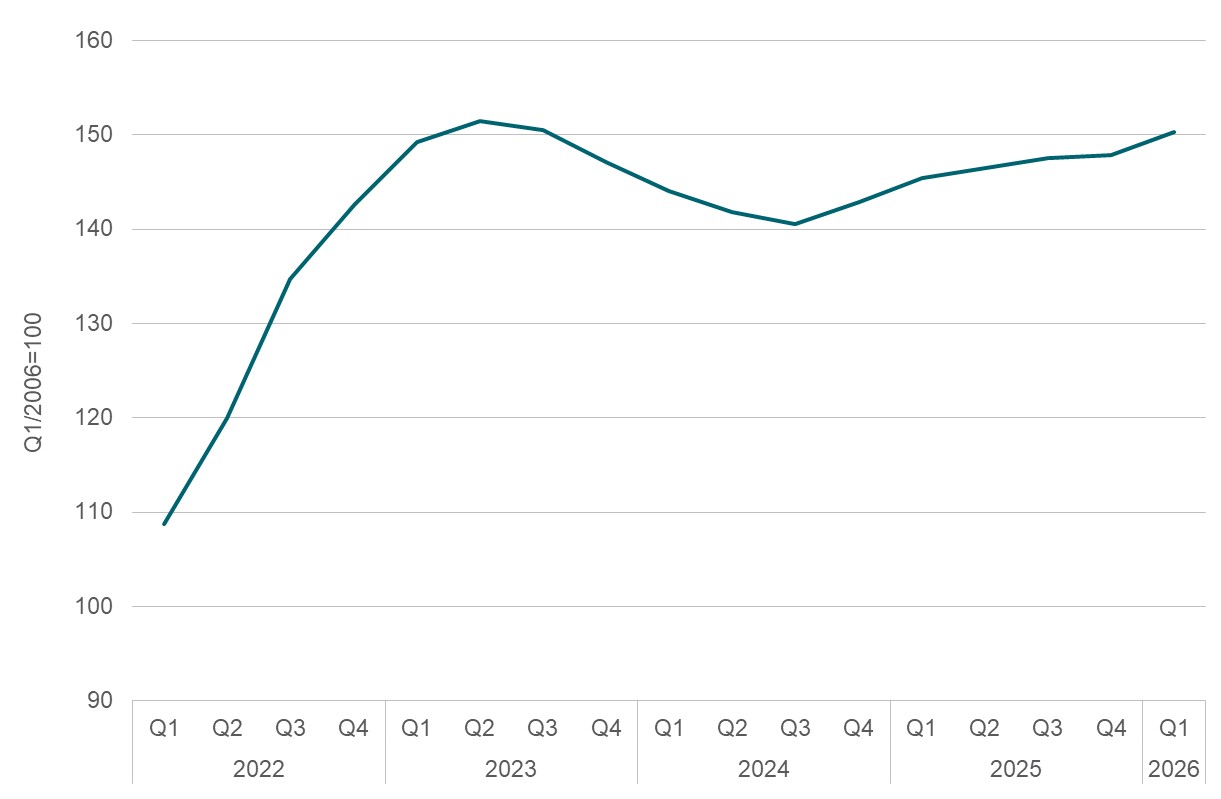
One reason may simply be that supply growth remains relatively manageable.
Only 911 private residential units (excluding ECs) received TOP in Q1 2026, which is almost negligible; it pushes total private housing stock up by just 0.2 per cent.
This may change going forward however, as we saw a lot of new launches in the CCR over 2025; as more of these newer projects are completed, tenants in the CCR may find a greater variety of options.
That aside, demand also remains heavily concentrated in a handful of mega-developments.
Normanton Park alone recorded 265 lease contracts in Q1 at a median rent of $6.19 psf, whilst Marina One Residences saw 141 deals at $6.49 psf.
This is quite significant as, in earlier years when we first saw mega-devs, competition was a concern.
When some of these projects first launched, a common argument against them was that too many competing landlords would suppress rents.
The logic was that if hundreds of similar units entered the market at once, landlords would end up competing on price. But in practice, that theory hasn’t played out.
Depending on whether this trend continues, it could allay concerns about mega-devs as rental assets in future.
Even when tenants become more cautious, rents still don’t soften easily. That won’t change as long as supply growth remains manageable, and landlords remain well-capitalised. This could also be why the “landlord dream” remains alive despite ABSD, and rising home prices. Singapore’s rental market is remarkably resilient; we rarely see situations where it crashes all at once. Even in the most uncertain times, it tends to just grind sideways for a while.
So far, the stubborn landlords have mostly won and gotten things their way.
| Project name | Price S$ | Area (sq ft) | $PSF | Tenure |
| Amber House | $5,408,000 | 1744 | $3,101 | FH |
| The Continuum | $4,668,000 | 1690 | $2,762 | FH |
| Hudson Place Residences | $4,612,000 | 1744 | $2,645 | 99 yrs |
| Elta | $3,898,000 | 1507 | $2,587 | 99 years (2024) |
| Bloomsbury Residences | $3,625,000 | 1421 | $2,551 | 99 years (2024) |
| Project name | Price S$ | Area (sq ft) | $PSF | Tenure |
| The Collective at One Sophia | $1,235,000 | 452 | $2,732 | 99 years (2023) |
| Narra Residences | $1,284,000 | 560 | $2,294 | 99 years (2025) |
| Hudson Place Residences | $1,455,000 | 646 | $2,253 | 99 years |
| The Continuum | $1,480,000 | 560 | $2,644 | FH |
| Altura | $1,553,000 | 990 | $1,568 | 99 years (2022) |
| Project name | Price S$ | Area (sq ft) | $PSF | Tenure |
| Nassim Park Residences | $15,600,000 | 3466 | $4,501 | FH |
| Grange Residences | $10,300,000 | 2852 | $3,611 | FH |
| One Robin | $4,720,000 | 1948 | $2,423 | FH |
| Melrose Park | $4,620,000 | 1701 | $2,717 | 999 years (1877) |
| Cuscaden Residences | $3,900,000 | 1453 | $2,684 | FH |
| Project name | Price S$ | Area (sq ft) | $PSF | Tenure |
| Kingsford Hillview Peak | $725,000 | 517 | $1,403 | 99 years (2012) |
| 8@Woodleigh | $790,000 | 398 | $1,984 | 99 years (2008) |
| The Panorama | $828,000 | 431 | $1,923 | 99 years (2013) |
| Eco | $853,000 | 700 | $1,219 | 99 years (2012) |
| Vacanza @ East | $870,000 | 560 | $1,554 | FH |
| Project name | Price S$ | Area (sq ft) | $PSF | Returns | Holding period |
| Nassim Park Residences | $15,600,000 | 3466 | $4,501 | $2,949,100 | 16 years |
| Melrose Park | $4,620,000 | 1701 | $2,717 | $2,680,440 | 29 years |
| Spanish Village | $3,638,888 | 1668 | $2,181 | $2,546,348 | 26 years |
| Villa Des Flores | $3,550,000 | 2034 | $1,745 | $2,200,000 | 20 years |
| Grange Residences | $10,300,000 | 2852 | $3,611 | $2,100,000 | 15 years |
| Project name | Price S$ | Area (sq ft) | $PSF | Returns | Holding period |
| ROBINSON SUITES | $1,430,000 | 603 | $2,372 | -$329,554 | 15 years |
| REFLECTIONS AT KEPPEL BAY | $3,390,000 | 1905 | $1,779 | -$255,950 | 9 years |
| ECO | $853,000 | 700 | $1,219 | -$120,600 | 13 years |
| OUE TWIN PEAKS | $3,500,000 | 1399 | $2,501 | -$109,420 | 10 years |
| THE TIER | $870,000 | 549 | $1,585 | -$35,000 | Four years |
| Project name | Price S$ | Area (sq ft) | $PSF | ROI (per cent) | Holding period |
| Summerhill | $2,688,000 | 1389 | $1,936 | 258 per cent | 21 Years |
| Spanish Village | $3,638,888 | 1668 | $2,181 | 233 per cent | 26 Years |
| Lakeholmz | $2,050,000 | 1518 | $1,351 | 208 per cent | 23 Years |
| Alpha Apartments | $2,650,000 | 2465 | $1,075 | 205 per cent | 21 Years |
| Oleander Towers | $1,830,000 | 1141 | $1,604 | 198 per cent | 19 Years |
| Project name | Price S$ | Area (sq ft) | $PSF | ROI (per cent) | Holding period |
| Robinson Suites | $1,430,000 | 603 | $2,372 | -19 per cent | 15 years |
| Eco | $853,000 | 700 | $1,219 | -12 per cent | 13 years |
| Reflections at Keppel Bay | $3,390,000 | 1905 | $1,779 | -7 per cent | Nine years |
| The Tier | $870,000 | 549 | $1,585 | -4 per cent | Four years |
| Affinity at Serangoon | $908,888 | 538 | $1,689 | -3 per cent | Three years |
[[nid:736061]]
This article was first published in Stackedhomes.