

8 outperforming stocks to buy now

PHOTO: Reuters
For the vast majority of investors looking to select individual stocks that will outperform the market, they tend to fall short. While I am not against buying individual stock counters (I do so myself), the reality is that most stock selections by retail investors fail to live up to their expectations.
Everybody wants to find the next Netflix or Amazon. Who doesn’t?
In this article, I am not looking to discover the next 100-bagger but to highlight 8 Outperforming Stocks that you can consider strategically adding into your portfolio. To qualify, these stocks need to demonstrate both long-term outperformance track record as well as exhibit short-term price momentum acceleration.
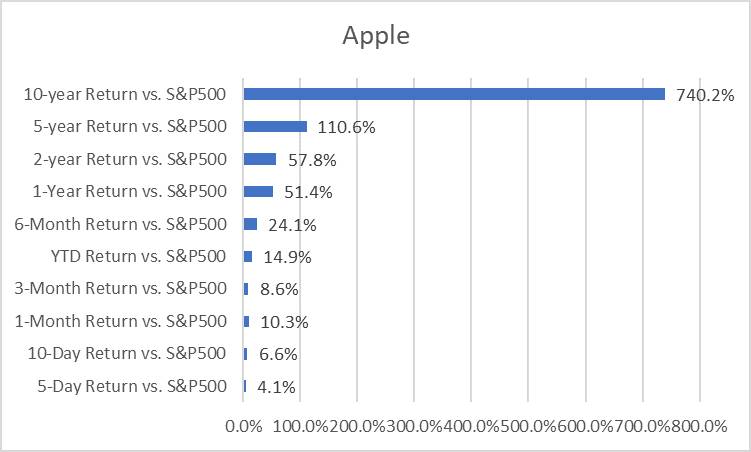
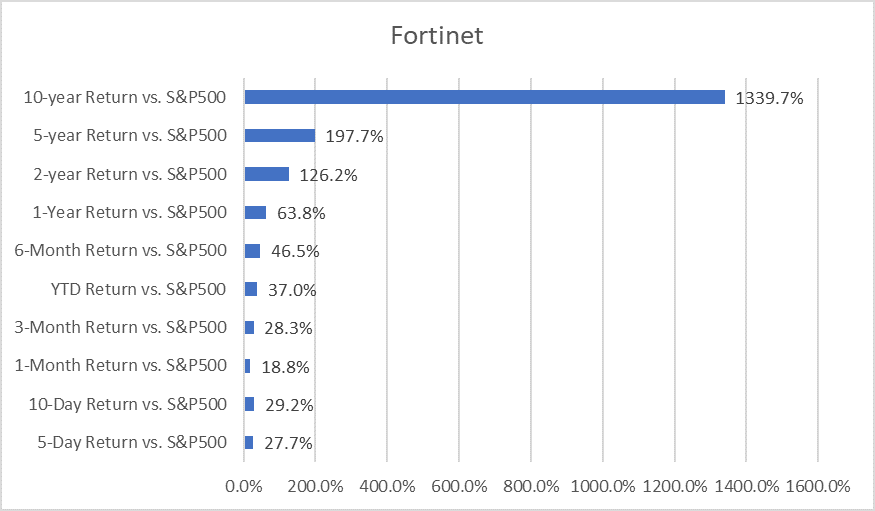
That is why among the 500 S&P counters, only 8 meets these stringent criteria. These stocks are screen on outperforming the S&P500 market by a certain percentage point over 5 days, 10 days, 1 month, 3 months, YTD, 6-months, 1 year, 2 years, 5 years and 10 years .
Yes, these 8 outperforming stocks beat the market on all these time frames. Essentially, they are extremely consistent price performers.
They might not be your next Netflix or Amazon, but betting on these consistent price performers will give you a larger than average probability of beating the market regardless of macro volatility, in my view.
Combined, a portfolio holding equal weighting of these 8 stocks over the past 10 years would have generated 1170per cent. A 10k portfolio at the start of the decade would now have a current market value of $117,000. Not too bad.
Comparatively, the S&P500 appreciated by 220per cent during the same duration.
Without further ado, these 8 outperforming stocks that crush the market in the last 10 years are:
The counter needs no introduction. Apple designs a wide variety of consumer electronic devices, including smartphones (iPhone), tablets (iPad), PCs (Mac), smartwatches (Apple Watch), and TV boxes (Apple TV), among others.
The iPhone makes up the majority of Apple’s total revenue. Also, Apple offers its customers a variety of services such as Apple Music, iCloud, Apple Care, Apple TV+, Apple Arcade, Apple Card, and Apple Pay, among others.
Apple’s products run internally developed software and semiconductors, and the firm is well known for its integration of hardware, software, and services.
Apple’s products are distributed online as well as through company-owned stores and third-party retailers. The company generates about 40per cent of its revenue from the Americas, with the remainder earned internationally.

Apple has been a rather consistent performer in terms of top-line and bottom-line growth. From 2015-2019, revenue increased from US$235 billion (S$330 billion) to US$268 billion or a CAGR of 3.3per cent.
The company has also been a consistent purchaser of its shares, a corporate action that has been scorn at of late due mainly to the buyback controversies surrounding airlines.
Consequently, EPS grew at a faster CAGR of 7.7per cent over this period. The strong price appreciation of Apple, however, is due to the huge uplift in terms of its PER multiple which has increased from a mere 11.4x back in 2015 to the current level of 24.7x based on 2019 earnings.
Apple is lightly geared at present and is probably one of the last companies on Earth to face funding pressure despite Covid-19 disrupting its retail operations to a fairly large extent.
The company generates quite a sizeable amount of free cash flow per share of $14.4 which translates to a current Price / FCF multiple of 21.5x.
The company’s ROE has been impressive at 64per cent as of end-2019, largely due to its enormous shareholder equity reduction from its share buyback. ROIC has also been hovering in the high 20s, a very strong ratio.
Apple has been growing its dividend steadily over the last 5 years and currently yields c.1per cent, not attractive enough to be considered a yield play.
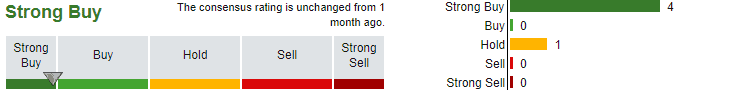
Among the 26 analysts that cover the counter, most are hugely positive on the stock with 17 analysts in the street rating the stock a Strong BUY.

Adobe’s outstanding outperformance against the S&P500 has mainly come from the last 5 years.
Adobe provides content creation, document management, and digital marketing and advertising software and services to creative professionals and marketers for creating, managing, delivering, measuring, optimising and engaging with compelling content multiple operating systems, devices and media.
The company operates with three segments: Digital media content creation, digital experience for marketing solutions, and publishing for legacy products (less than 5per cent of revenue).
We recently featured Adobe as one of 4 stocks with more than 80per cent recurring revenue owned by Gurus. The recurring revenue ratio for Adobe is more than 90per cent.
It was not too long ago in 2013 when Adobe had about $200 million in annual recurring revenue. In its last fiscal Year 2019, the company generated $10 billion in recurring subscription revenue.

An almost picture-perfect Income Statement with revenue growing by a CAGR of 23.5per cent over the last 5 years to US$11.2 billion.
Adobe’s EPS has been even more impressive, increasing by a CAGR of 48per cent to $6/share as of end-2019. The company has also been active in buying back its shares with outstanding share count decreasing from 507m in 2015 to 488m in 2019.
The only “downside” is that its trailing PER ratio is at a hefty 55x. Well, the counter has never been treated as a value stock in the first place.
Adobe has a strong balance sheet, with the company only in a marginally net debt position of $540 million which is extremely well-covered by its free cash flow generation of c.US$4 billion/year
Again, another counter with a strong ROE ratio of 28per cent and an ROIC ratio of 21per cent based on 2019 results, well above my internal requirement of 15per cent for ROIC.
All-in-all, a fantastic company to own with a high level of revenue visibility, even in today’s climate of elevated business uncertainty. However, that is assuming you find its elevated PER of 50+x palatable.
With 20 analysts covering the stock and ¾ of them issuing a Strong Buy on the counter, there is no doubt that the street is extremely positive on the future outlook of Adobe.
I like the stock as well and will be a buyer of dips.

With a history dating back more than 100 years, Clorox now sells a variety of consumer staples products, including cleaning supplies, laundry care, trash bags, cat litter, charcoal, food dressings, water-filtration products, and natural personal-care products.
Beyond its namesake brand, the firm’s portfolio includes Liquid-Plumr, Pine-Sol, SOS, Tilex, Kingsford, Fresh Step, Glad, Hidden Valley, KC Masterpiece, Brita, and Burt’s Bees. Around 85per cent of Clorox’s sales stem from its home turf.
Clorox is a quality dividend aristocrat that has increased its dividend for 42 consecutive years. The counter currently yields about 2.1per cent which is slightly below the industry average of 2.4per cent.

Clorox’s revenue has not been very impressive, to say the least, growing at a CAGR of just 1.9per cent over the last 5 years. Pretty much understandable for a consumer staple stock. The company’s EPS has been growing at a faster clip of 5.2per cent CAGR during this period.
The counter was previously trading at a trailing PER multiple of around 23x before the outbreak of Covid-19 that has seen Clorox becoming one of the strongest beneficiaries of this health pandemic due to its portfolio of cleaning products which has been highly sought after in this crisis.
At its present price of $204 with an expected forward EPS of $6.60, the counter is trading at a hefty 31x forward PER, a premium relative to its historical PER range.
While Clorox’s net debt of close to $3 billion as of end-2019 seems high relative to its equity base of $555 million, this is well-supported a strong free cash generation of close to $1 billion/annum.
The company also has a strong ROIC ratio of c.27per cent at the moment. Seems like most of these outperforming stocks have high ROIC as a common criterion.
Lastly, as mentioned, Clorox is a Dividend Aristocrat with a 42 years track record of consecutively increasing its dividend payment. With 2019 DPS of S$4.04 vs. 2019 EPS of $6.38, this translates to a payout ratio of 63per cent, below my 70per cent benchmark for dividend players.
The street is not overly positive on Clorox with a consensus Hold rating across 10 analysts covering the stock. I do concur with being a tad cautious on Clorox which could see demand for its cleaning products taper off once the Covid-19 issue becomes a thing of a past, or will it ever?

Fastenal opened its first fastener store in 1967 in Winona, Minnesota. Since then, Fastenal has greatly expanded its footprint as well as its products and services. Today, Fastenal serves its 400,000 active customers through approximately 2,100 stores, almost 1,200 on-site locations, and 14 distribution centers.
Since 1993, the company has added other product categories, but fasteners remain its largest category at about 30per cent-35per cent of sales. Fastenal also offers customers supply-chain solutions, such as vending and vendor-managed inventory.
Shares of Fastenal rose 16per cent in April due to a strong set of 1Q20 results which beat the street’s expectations despite Fasteners, the industrial firm’s namesake product line, saw a 10per cent drop in daily sales in March. However, due to its diversification strategy, its range of safety products increased by 31per cent.

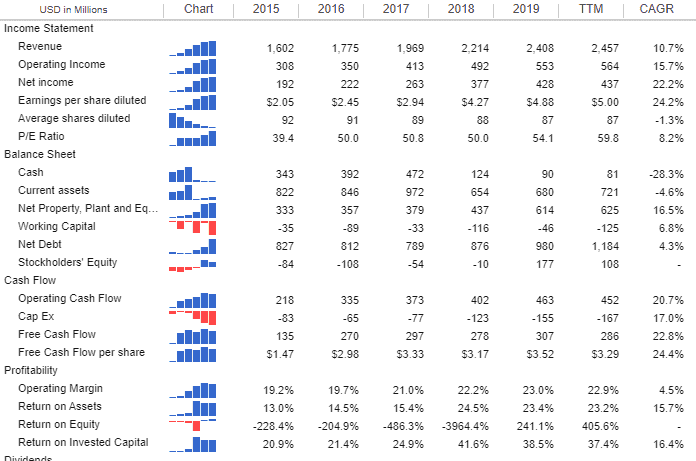
Another company with a strong track record of growing its revenue consistently, Fastenal’s revenue CAGR grew at 8.4per cent over the last 5 years with EPS growing at a slightly faster clip of 11.7per cent.
Share buyback has been rather marginal during this period while its PER multiple has inched up in 2019. According to the street’s expectation, Fastenal 2020 EPS is forecasted at $1.21, translating to a Forward PER multiple of 32x, significantly more than the average PER multiple in the mid-20s
Net debt of $416m as of end-2019 is well covered by a year free cash flow of close to $600 million. The company generates a high ROIC of 25per cent based on its 2019 results.
Fastenal’s DPS growth has been very strong, growing at a CAGR of 11.6per cent over the past 5 years, with the current payout ratio of 63per cent based on 2019 results.
The counter is covered by 11 analysts in the street with the majority of them giving a Hold rating to the stock.
As you might already notice, a common ratio that fares well for these outperforming stocks is a high ROE per cent/ROIC per cent.
This is also a Warren Buffett favourite ratio which he uses to gauge the efficiency of companies to generate profits using its capital.
Another common trait is that all these companies generate tons of free cash flow. While all of them operate with a certain amount of debt, their debt holdings are very well-covered by their free cash flow generation.
Stocks that consistently outperform the market tend to have a few common characteristics.
In part 1 of our article, we highlighted 4 outperforming stocks that have consistently beaten the market over the last decade. These 4 stocks are Apple, Adobe, Clorox, and Fastenal.
We identified that all 4 stocks have high ROE/ROIC as well as strong free cash flow generating capabilities.
In part 2, we will reveal the remaining 4 outperforming stocks on our list. Investors should consider strategically adding these stocks into their portfolio when the opportunity arises.
I will end the article by summarising the few common traits that these 8 outperforming stocks exhibit which might be useful in finding the next multi-bagger stock.
Fortinet is a cybersecurity vendor that sells products, support, and services to small and midsize businesses, enterprises, and government entities.
Its products include unified threat management appliances, firewalls, network security, and its security platform, Security Fabric. Services revenue is primarily from FortiGuard security subscriptions and FortiCare technical support.
At the end of 2019, products were 37 per cent of revenue, and services were 63 per cent of sales. The California-based company sells products worldwide, with the Americas representing 43 per cent of sales in 2019.
While Fortinet’s core cybersecurity business might not be immune from the Covid-19 outbreak, cybersecurity is undoubtedly a growing business over the coming decade and is mission-critical for any enterprise, no matter what’s happening in the world.
The company announced its 1Q20 results on 7 Feb which handily beat the street’s estimates, propelling the stock up by c.20 per cent the following day.
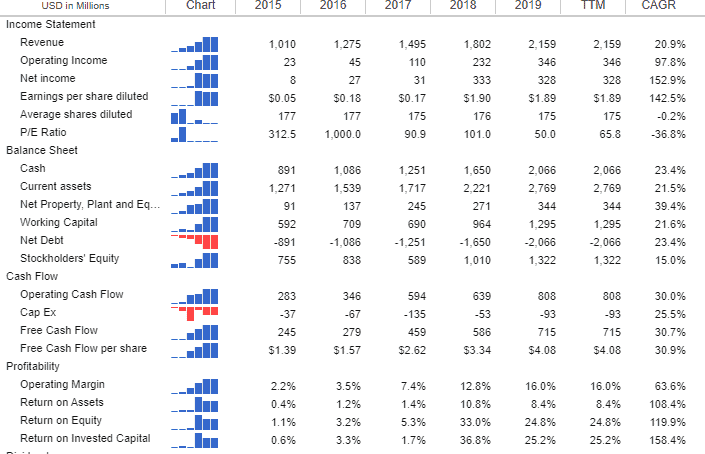
Fortinet has a fantastic business that is seeing its revenue growing by a CAGR of 20.9 per cent over the past 5 years.
EPS, on the other hand, has skyrocketed by a CAGR of 142.5 per cent during the same period as the company achieves significant operating leverage in the past 3 years. Observe that the company’s operating margin increased from 2.2 per cent in 2015 to 16 per cent in 2019.
I noticed that companies that can achieve significant operating leverage tend to demonstrate strong share price appreciation. Fortinet is clearly one of them.
The company has a fortress-like balance sheet, with cash increasing from $891 million in 2015 to $2066 million in 2019.
The company has absolutely zero debt. Its founder and CEO, Ken Xie doesn’t appear to believe in debt since the company has been debt-free since 2009.
With a free cash generation of $4.08, the company is trading at a trailing-Price/FCF of 34x. While not a low multiple, it is definitely more palatable than the 46x forward PER that it is currently trading at.
Based on its 1Q20 free cash flow generation of $292 million vs. 1Q19 free cash flow of $191 million, Fortinet looks to be on track to generate $1 billion in free cash flow for 2020.
That will value the company at c.23x forward Price/FCF which is very good for a company growing its free cash flow by c.31 per cent/annum over the last 5 years.
Again, this is another company that has a high ROIC of 25.2 per cent and this has been achieved without significantly reducing its equity due to share buybacks.

The overall street consensus is a Buy for the counter, although 10 analysts are instituting a Hold call on the stock, likely due to valuations where Fortinet’s EV/EBITDA, P/E, P/S multiples, etc are on the high side vs. peers.
This is however more than compensated by its strong historical and forward growth profile.

Idexx Laboratories primarily develops, manufactures, and distributes diagnostic products, equipment, and services for pets and livestock.
Its key product lines include single-use canine and feline test kits that veterinarians can employ in the office, benchtop chemistry and hematology analysers for test-panel analysis on-site, reference lab services, and tests to detect and manage disease in livestock.
Idexx gets about 38 per cent of its revenue from outside the United States.
This was a stock that I previously analysed using Buffett style of investing in this article: Buffett Series: Idexx Laboratories back in Oct 2019 with the conclusion that while the share price seems elevated at that point of time (trading at US$272/share; current share price at US$299/share), Idexx is a recession-proof business that can generate an after inflation CAGR of 7.6 per cent over the next 10-years and that there is a business case to take a position in that counter.
Another steady grower of its revenue with a CAGR of 10.7 per cent over the past 5 years. EPS grew by 24.2 per cent as a result of a combination of both operating leverages as well as a declining share base.
Currently trading at a forward PER of 51x, Idexx has not de-rated due to the Covid-19 pandemic.
Idexx’s balance sheet is not as strong as our previous candidates, with a net debt balance of $980 million as of end-2019.
With equity of $177 million, net debt to equity was at over 8x which seems excessive at first glance, but that was mainly due to years of share buyback that has decreased its equity base, very similar to stocks such as McDonald and Disney.
What is more meaningful is looking at the amount of operating cash flow that the company generates each year.
That has been showing a very consistent uptrend alongside profit growth, the ideal scenario we will like to observe. The company also generates a decent amount of free cash flow.
On an ROIC basis, Idexx generates an ROIC of 38.5 per cent in 2019, an incredibly high ratio.
Idexx is not covered by many analysts (only 5) but out of the handful of analysts covering the stock, 80 per cent of them rated the counter a Strong Buy.
MarketAxess Holdings Inc is a United States-based company engaged in operating an electronic trading platform.
The platform enables fixed-income market participants to trade corporate bonds and other types of fixed-income instruments using patented trading technology.
It also provides related data, analytics, compliance tools, and post-trade services.
The key trading products are U.S. High-Grade Corporate Bonds, Emerging Markets Bonds, U.S. Crossover and High-Yield Bonds, Eurobonds, U.S. Agency Bonds, Municipal Bonds and others.
The business operations of the company carried in the United States, the United Kingdom, and other countries, of which a majority of the revenue is derived from the United States.
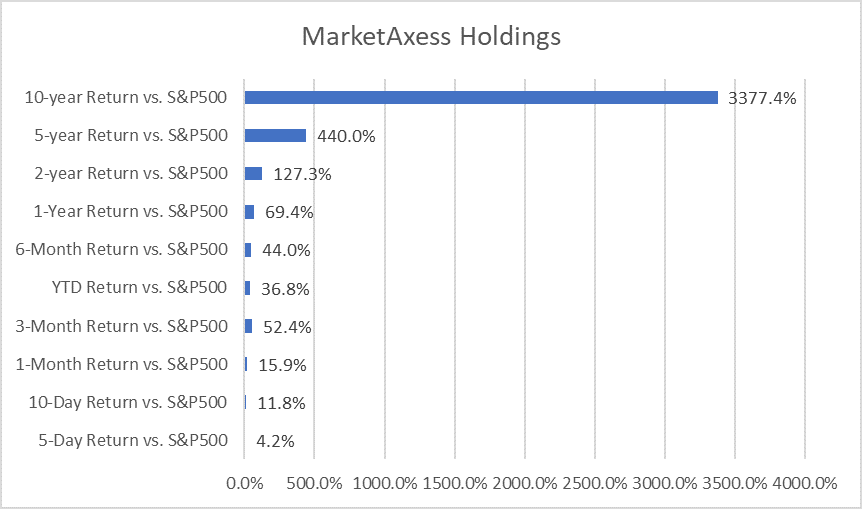
One of the best stocker performers of the decade, Market Axess holdings is a counter that most people will not be overly familiar with.
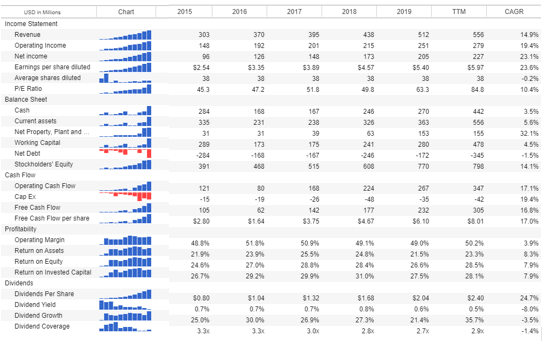
The counter grew its revenue by c.15 per cent over the past 5 years while EPS grew by c.24 per cent mainly due to improvement in its operating margins.
The counter has seen a huge re-rating in its PER multiples, almost doubling from 5 years ago. This is likely due to the market perception of a strong demand for bonds trading.
Market Axess has a pristine balance sheet where its current assets mainly comprise of cash. The company has very little debt and is in a net cash position.
The company generates strong free cash flow and is again another company that has a high ROIC multiple of c.27.5 per cent as of end-2019.
Lastly, the company is a very strong dividend growth counter, with its dividend growth at 20 per cent for the past 5 years.
Despite that, its yield is currently at a paltry 0.5 per cent, due mainly to the counter’s strong share price appreciation.

Out of the 7 analysts covering the counter, most of them have a Hold rating on the counter. However, the stock has continued to outperform the market’s expectations in terms of share price performance.
Microsoft develops and licenses consumer and enterprise software.
It is known for its Windows operating systems and Office productivity suite.
The company is organised into three overarching segments: productivity and business processes (legacy Microsoft Office, cloud-based Office 365, Exchange, SharePoint, Skype, LinkedIn, Dynamics), intelligence cloud (infrastructure- and platform-as-a-service offerings Azure, Windows Server OS, SQL Server), and more personal computing (Windows Client, Xbox, Bing search, display advertising, and Surface laptops, tablets, and desktops).
Through acquisitions, Microsoft owns Xamarin, LinkedIn, and GitHub. It reports revenue in product and service and other revenue on its income statement.
Microsoft is the only company that has remained in the top 10 largest market cap company in the world consistently since 2000.
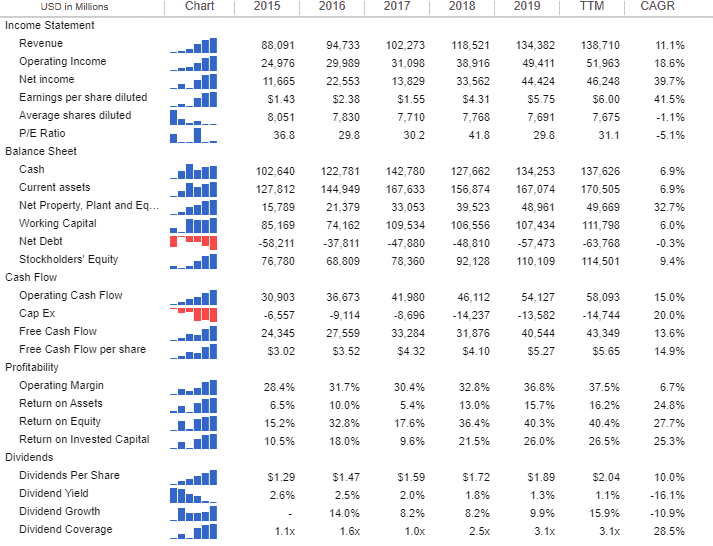
Consistent revenue growth (5-years CAGR at 11 per cent) with a growing operating margin and a reduction in outstanding shares, ultimately translating to a 41.5 per cent EPS CAGR over the past 5 years seem to be Microsoft secret recipe to being the largest (if not second largest) market cap company in the world at present.
The company is a cash-generating monster with c.$134 billion in cash as of end-2019 and a net cash position of $57 billion.
This can only be achieved due to its strong free cash flow of c.$40 billion in 2019 which has been growing at a CAGR of 13.6 per cent over the past 5 years.
A company with an ROIC of 26 per cent, Microsoft is also a consistent dividend payer with dividend growth almost hitting 10 per cent/annum.
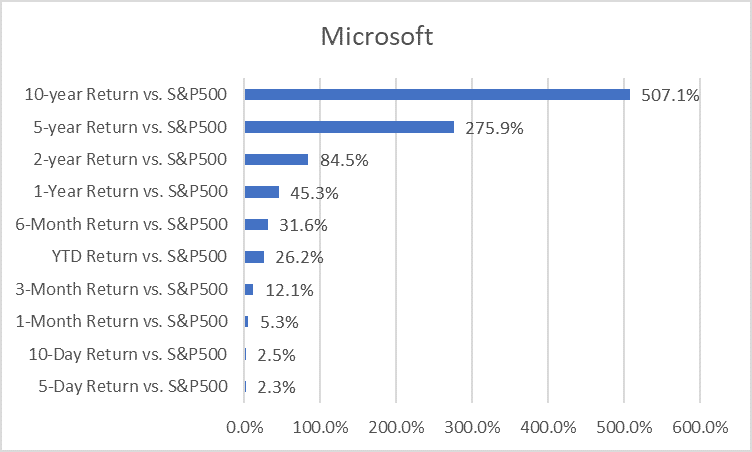
All-in-all, Microsoft seems to be hitting the right button in all operational areas which is the reason why its share price has been consistently outperforming over the past decade.
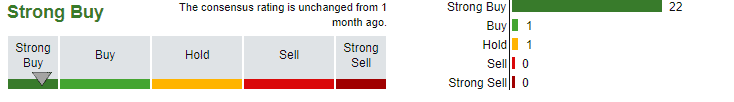
With 24 analysts covering the counter and 22 issuing a Strong Buy, Microsoft is well-loved by the street.
These 8 outperforming stocks have been the most consistent share price outperformers, not just over the past decade but during the recent health pandemic as well.
Most of them exhibit certain common characteristics of a good company which I will like to briefly summarise:
Interestingly, the PER multiple seem less relevant as growth precedes value.
A major concern of growth companies is often the fact that when growth in these companies starts to decline, they might get into credit-related issues as most would have been growing through the usage of debt or issuing new equity.
On the other hand, a growth company such as those above which demonstrates the ability to consistently generate free cash flow to internally fund their growth through both organic or inorganic means, instead of turning to the capital market for funds, will be favorably viewed upon.
This article was first published in New Academy of Finance in two parts.