Cooling measures 101: Signs to note based on past exercises

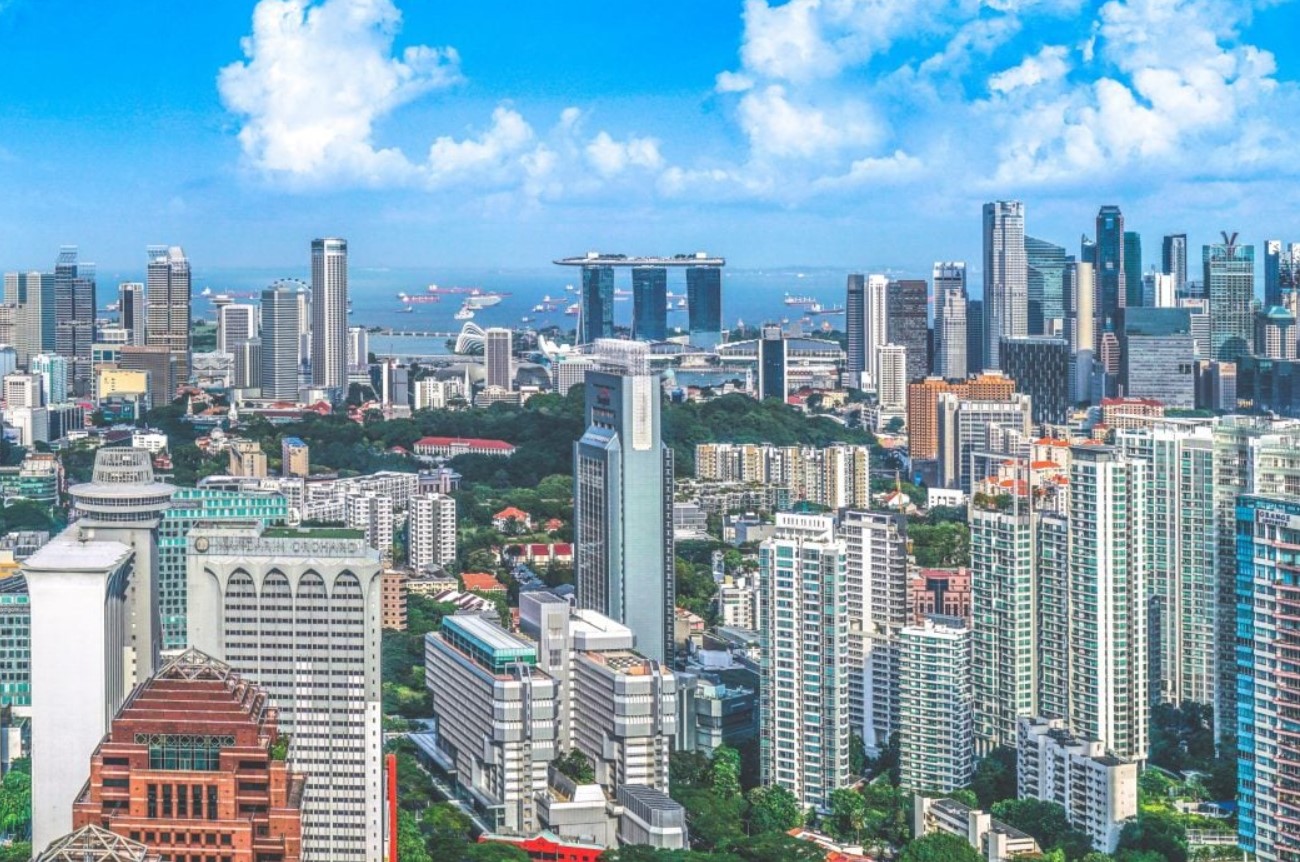
PHOTO: The Straits Times
On April 27, 2023, new cooling measures in Additional Buyers’ Stamp Duty (ABSD) were introduced, with double the taxation on foreigners buying their first and 2nd homes.
April’s measures come on the back of an increase in Buyer’s Stamp Duty for high-end properties in February, and an affordability stress-test (and waiting periods for private home sellers) policy in September last year.
Since 2013, there have been more measures implemented over the last 1.5 years than in any other period.
Here’s a quick look at cooling measures since 2010 and their impact on private and HDB property transaction volumes and prices.
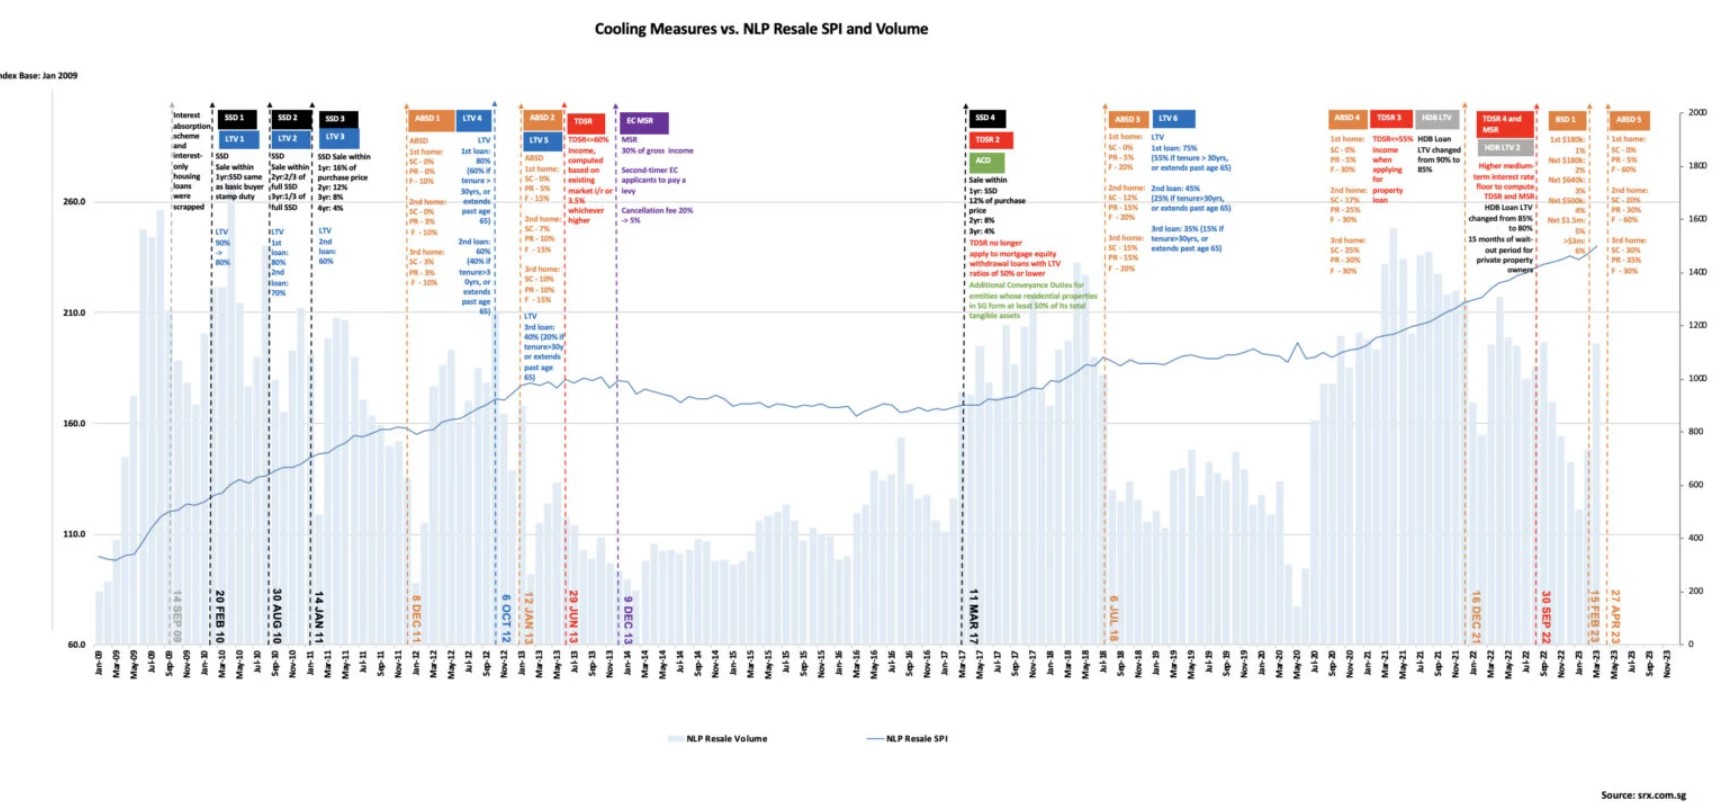
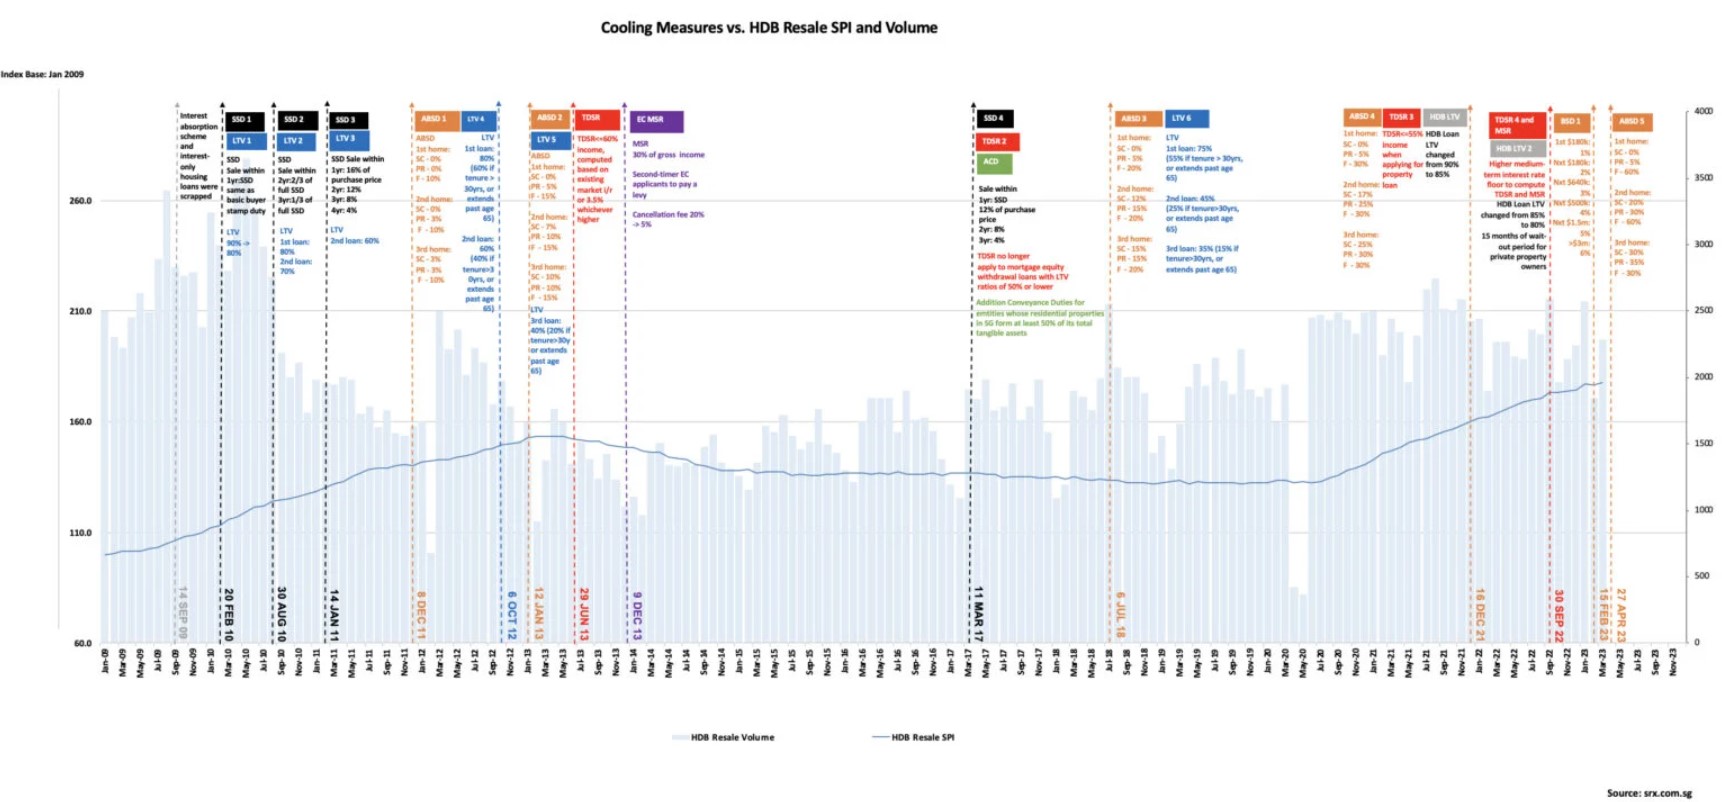
The SRX chart above shows the different cooling measures (marked by each vertical line and the corresponding policies) introduced in Singapore.
In general, cooling measures are policies put in place by the government, usually to rein in an overheated property market, marked by runaway prices (as shown in the trendline above) and/or insatiable transaction volumes (corresponding bar chart).
Some measures are extremely targeted, such as the EC Mortgage Servicing Ratio (MSR) policy of December 2013, which are for Executive Condominium buyers, and the 35per cent ABSD on properties bought in Trust, implemented in May 2022.
Others affect a wider profile of home buyers and sellers, such as tightening in Total Debt Servicing Ratio (TDSR) and Loan-to-Value Ratio (LTV). A few are forced by international policies, such as the stress-test interest rate measure, which enforces prudent borrowing after a quick succession of US interest rate hikes.
Based on the chart, we can share some observations:
Naturally, one reason why there has been a succession of cooling measures over the past year is due to a gap in supply and demand. As homebuyers recalibrate their lives after holding back throughout the pandemic (read: binge-shopping), there is now heightened demand to satiate their home-shopping desires.
Unfortunately, as the demand came quite suddenly, developers and suppliers are finding it ever-challenging to keep up. This discrepancy will cause a surge in prices – home prices, rents, and maintenance costs.
A real case study would be the period between 2010 and 2013, when Singapore recovered from the Global Financial Crisis of 2008/2009 and pent-up demand caused home prices to surge (you can see the price index dipping post-2011 cooling measure before the gradual ascend again).
So besides monitoring demand in the form of prices and volume, we should be looking at the supply pipeline as well.
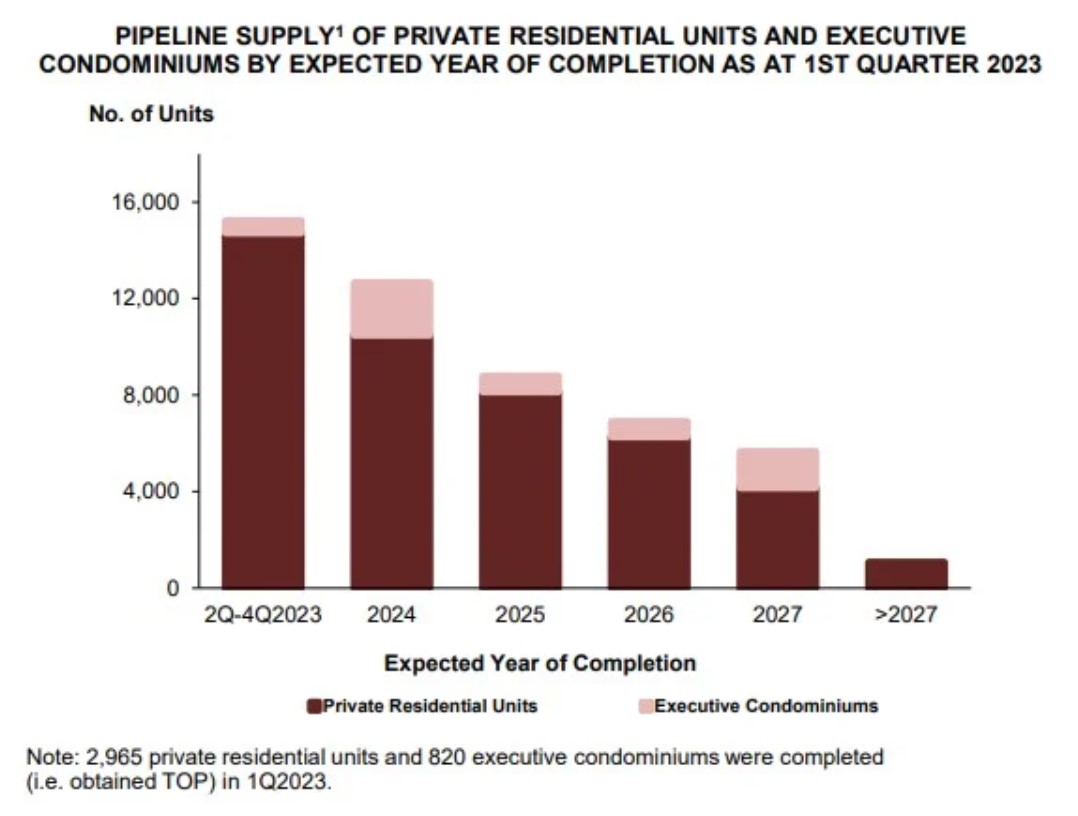
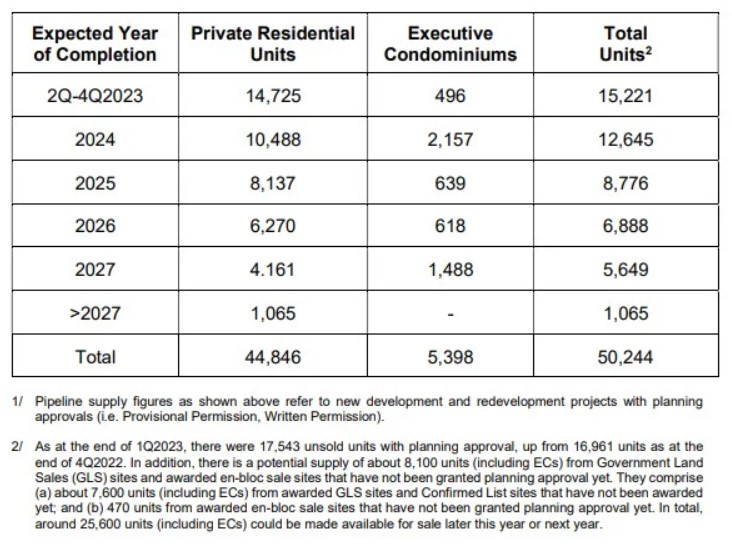
Just remember this: If supply goes up, prices are expected to stabilise (or hopefully do). If supply continues to falter to meet ever-increasing housing demand, then the government will need to step in and introduce cooling measures to temper it down – just like what they did in 2013, and recently.
Since the December 2021 cooling measures, several additional measures have been introduced, some of them within a few months of each other.
These include waiting periods for private property sellers (Sept 2022), BSD hikes (Feb 2023), and April 2023’s ABSD rate increases.
As you can tell, each measure has, in some way, a targeted group or home-buying profiles in mind – meant to close off certain gaps among a larger pool of buyers.
What this means is that we cannot rule out that these measures are sufficient for years to come. Due to geopolitics impacting the regional flow of funds and the after-effects of pandemic restraint, new gaps may emerge in quick successions, and hence, new measures may be needed.
Pockets of intense scrutiny may be in areas like rental hikes, the all-cash, high-COV HDB resale market, and how foreigners whose countries are under FTAs with Singapore are buying property. For the latter, nationals and PRs of Iceland, Liechtenstein, Norway and Switzerland, and US citizens are subject to the same ABSD rate as Singaporeans, meaning they pay 0per cent ABSD on their first property here.
If you look back at past measures, many were introduced at the end of a particular quarter: 30 September 2022 (end-Q3), 16 December 2021 (end-Q4), 6 July 2018 (early Q3), 29 June 2013 (end-Q2), 12 Jan 2013 (early Q1) and so on.
The most recent 27 April 2023 measure on ABSD came on the heels of URA’s Q1 2023 statistics for private residential properties.
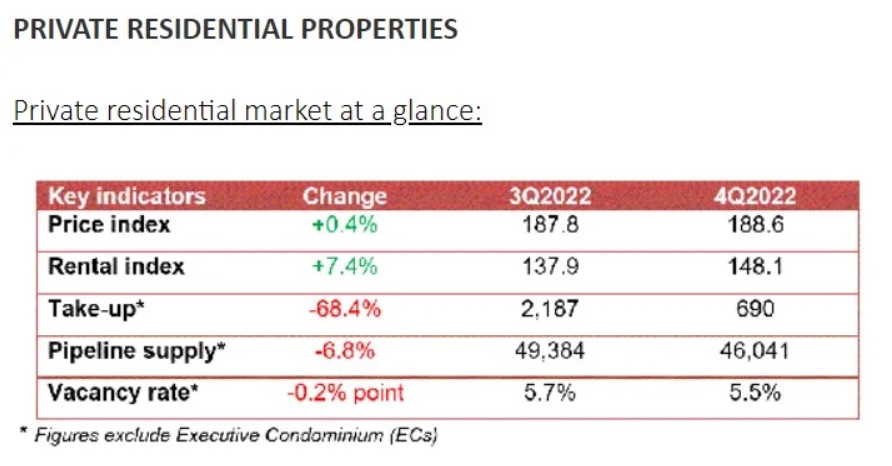
For context, URA’s Q4 2022 stats showed prices of private residential properties slowing down with only a 0.4 per cent growth compared to the previous quarter. Not only that, take-up (which denotes the number of units sold quarter-to-quarter) was almost negative 70 per cent. Many analysts attributed this to the impact of September’s measures, suggesting that the policies were working.
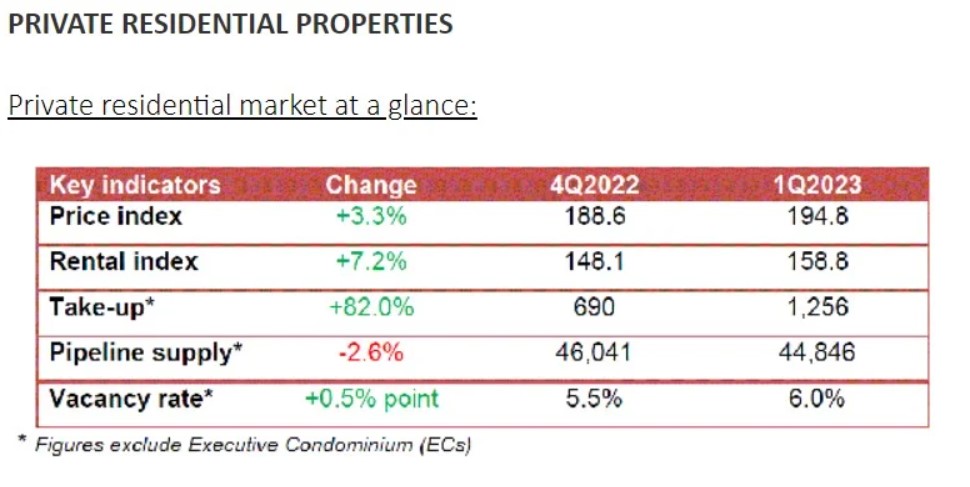
However, Q1 2023 stats showed a reversal, with the price index increasing by 3.3 per cent and take-up surging by 82 per cent. This is despite a BSD rate hike in February 2023, which targets properties priced from $1.5 million and above.
In Q1 2023, we read about some 20 units in Klimt Cairnhill being sold to foreigners. Then, there was a 6,286-sqft unit at Les Maisons Nassim which was sold for S$36m in the same quarter (at $5,727 psf).
So April’s measures, which had the highest rate hikes towards foreigners, would have taken these statistics into account – and what do you know – it’s out after March (the end of Q1).
If you need another example, check out 2018’s. In Q4 of 2017, the price index rose a mere 0.8per cent over Q3 2017. Take-up was negative 30 per cent.
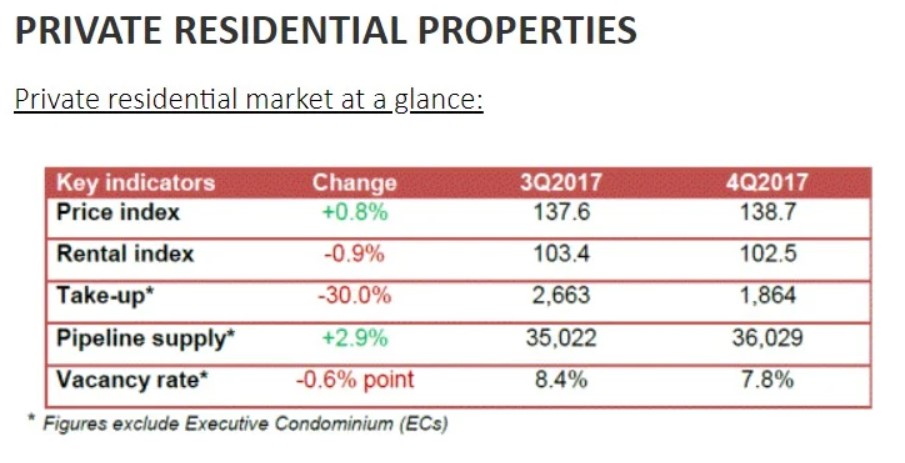
But the reverse happened over the next quarter, when the price index rose by almost 4per cent. Still, take-up fell by about half of the previous quarter, so maybe it’s more of a one-off?
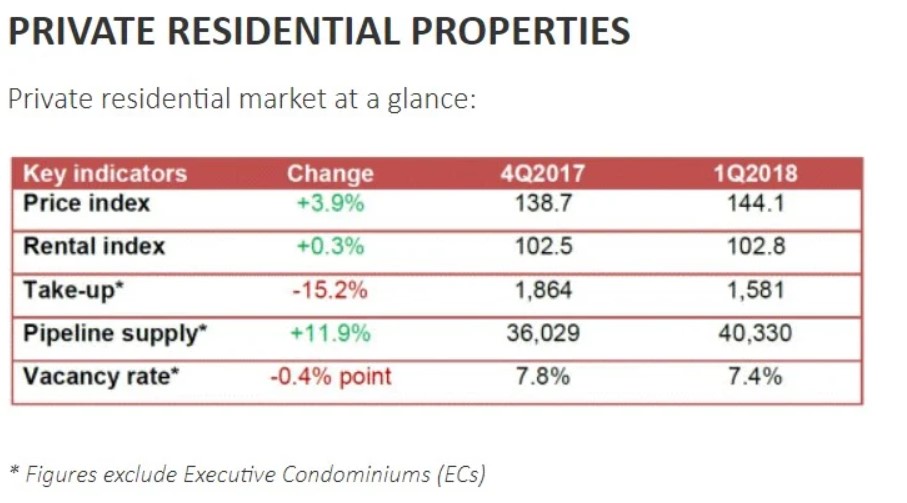
Then in Q2 2018, the price index continued to rise by 3.4per cent. Not only that, the take-up rose by nearly 50 per cent.
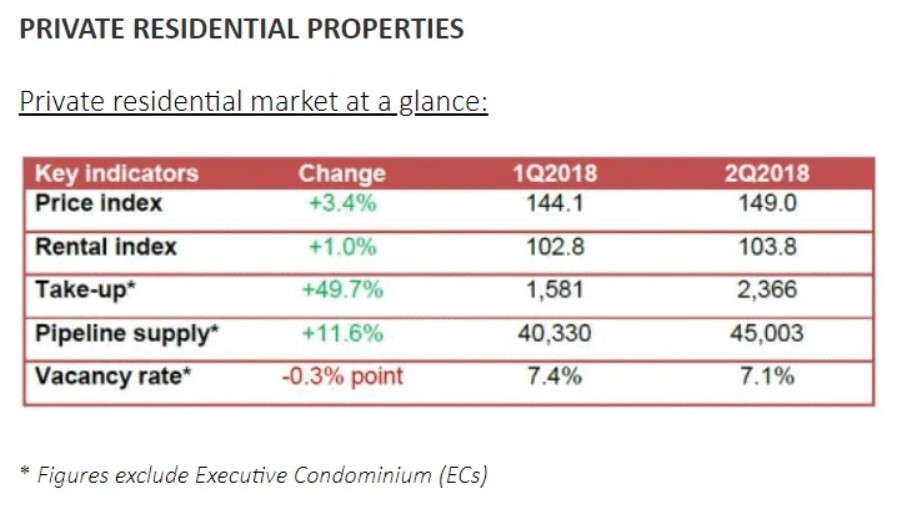
Can you guess what happened right after Q2 2018? Yes, new cooling measures were introduced on July 6, 2018 on both ABSD and LTV.
So, want some advice? Instead of Netflix and Disney+, watch the URA statistics (and SRX’s price index for HDB resale and private landed/non-landed properties) instead.
If you study the number of cooling measures on an annual basis since 2010 at least, one of the more restrictive years would probably be 2013, when three large measures were introduced. They were evenly spread out – Jan 12, 2013, June 29, 2013 and Dec 9, 2013.
The Jan 2013 measure was on LTV and ABSD, which by now, we know are meant to curb speculative buying and investment in 2nd and subsequent properties. The June 2013 measure was on TDSR, which focused on income affordability. Finally, the Dec 2013 measure was for EC buyers, also to ensure affordability.

As of April 2023, two measures have been introduced (unless you see the recent changes to HDB grant distribution as a form of cooling measure). The first was the BSD rate hike in Singapore’s February budget, aimed at higher-priced properties, and the second was the April ABSD rate increase, mainly aimed towards foreigners.
Based on the price index, it has yet to form a bowl pattern, like what the three measures in 2013 eventually did. That pattern lasted for about four to five years.
In other words, a further runaway spike in pricing and take-up over subsequent quarters this year would be concerning to the authorities, and naturally, the impact of the decisions they make thereafter.
So what do these observations mean and how do they apply to you?
If you’re a home buyer or seller, we hope some of these signs will help you make more informed decisions. You don’t want a situation where you’re caught like these folks.
Furthermore, cooling measures aren’t haphazard or stop-gap measures the government makes on a whim. We’re very sure they ponder over reams and reams of forecasted data and statistics before coming to a cooling measure decision. The URA statistics on private residential homes and HDB’s own Resale Price Index are also publicly available for everyone.
The following are Researcher Reports for HDB resale, condo, ECs and landed across the three different regions (CCR, RCR and OCR) from Q1 2010 to Q1 2023. Feel free to cross-reference them against the different times cooling measures were implemented.
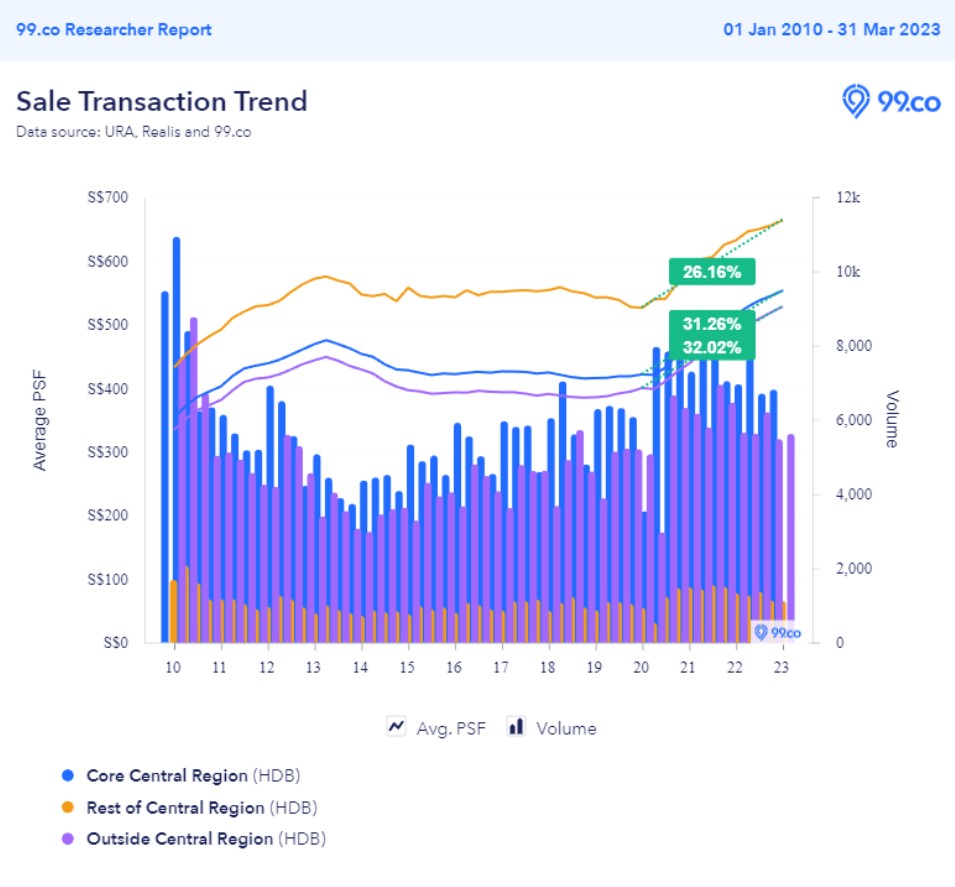
An overview of quarter-to-quarter average psf price and volume increases in the HDB market according to region. Quarterly average psf prices of HDB resale flats in the OCR have surged by 32.02% since Q1 2020, due mainly from COVID, WFH and families looking for larger spaces.
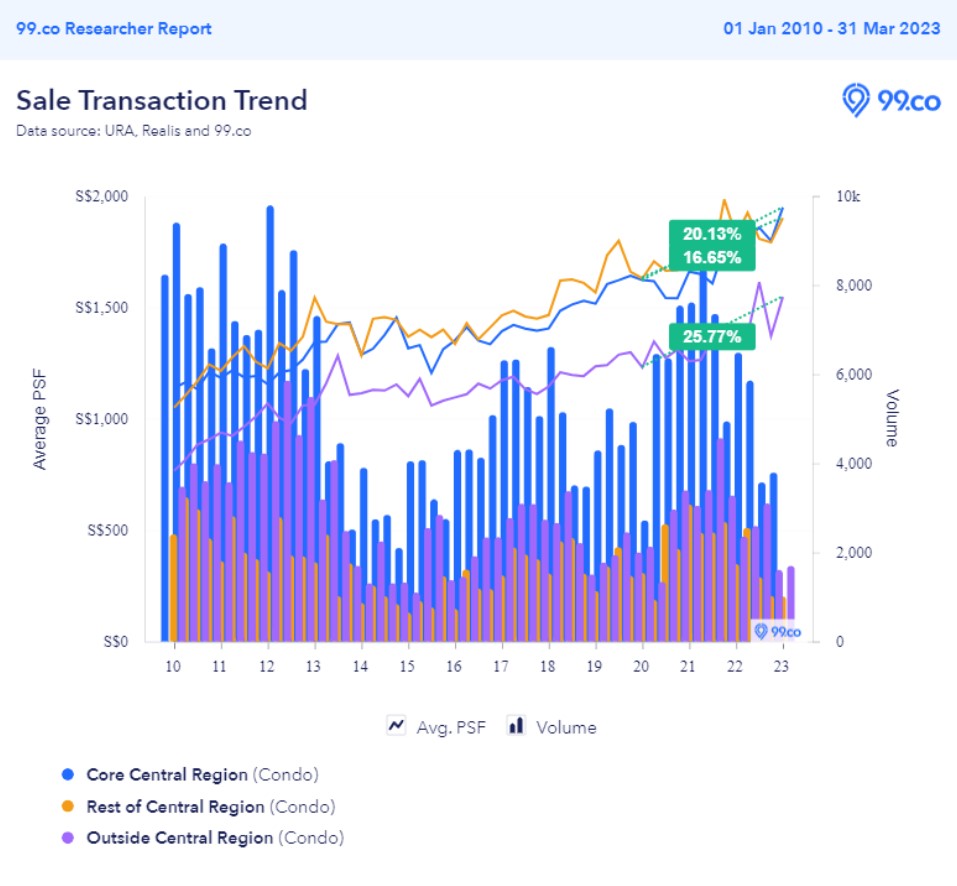
For condos, quarterly average psf prices of OCR condos have risen the highest at 25.77% since the pandemic DORSCON Orange. Similarly, this was driven mainly because of COVID, WFH and lower psf prices of condos in self-sustaining and well-developed suburban towns.
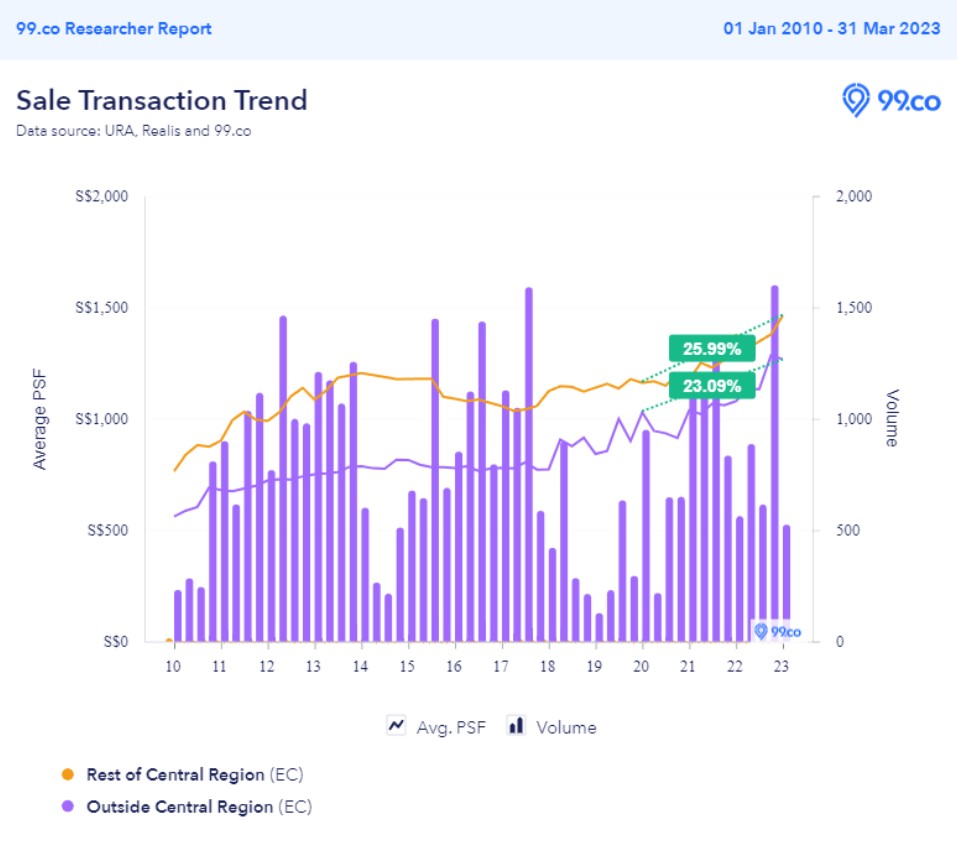
Executive Condos (ECs), mostly located in the OCR, saw quarterly average psf prices rise by more than 23% since Q1 2020. The transaction volumes may show a seasonal pattern but this is probably an effect of resale ECs entering the market after serving a 5-year Minimum Occupation Period (MOPs) and 10-year privatisation period.
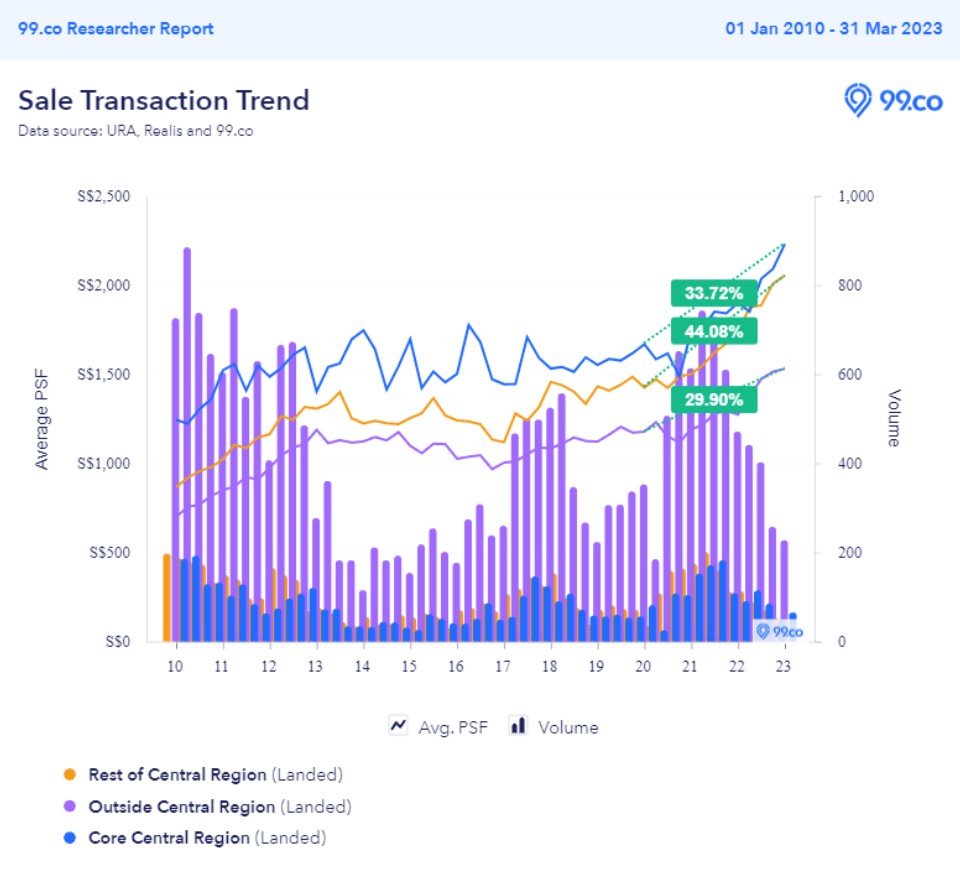
Finally, for landed properties, the biggest quarterly average psf price increase came from landed homes in the RCR, with a 44.08 per cent spike since Q1 2020. Though volume is much lower than OCR landed properties, RCR landed homes form a significant pool of demand due to their locations within prized neighbourhoods like GCB Areas in the city-fringe area.
Across all property types, quarterly average psf prices have risen significantly since Q1 2020 (the start of the pandemic). With the exception of ECs, transaction volumes of all property types seem to show signs of a downtrend. Decreasing volumes may signal impending pressure for home prices to follow suit. If that happens, that may give the market some respite.
Until we see the next quarterly statistics (and the impact of April’s measures), it’s hard to tell, as we’re in uncharted waters here, especially for home pricing trends. Still, we hope these observations are helpful if you plan on selling or buying a home.